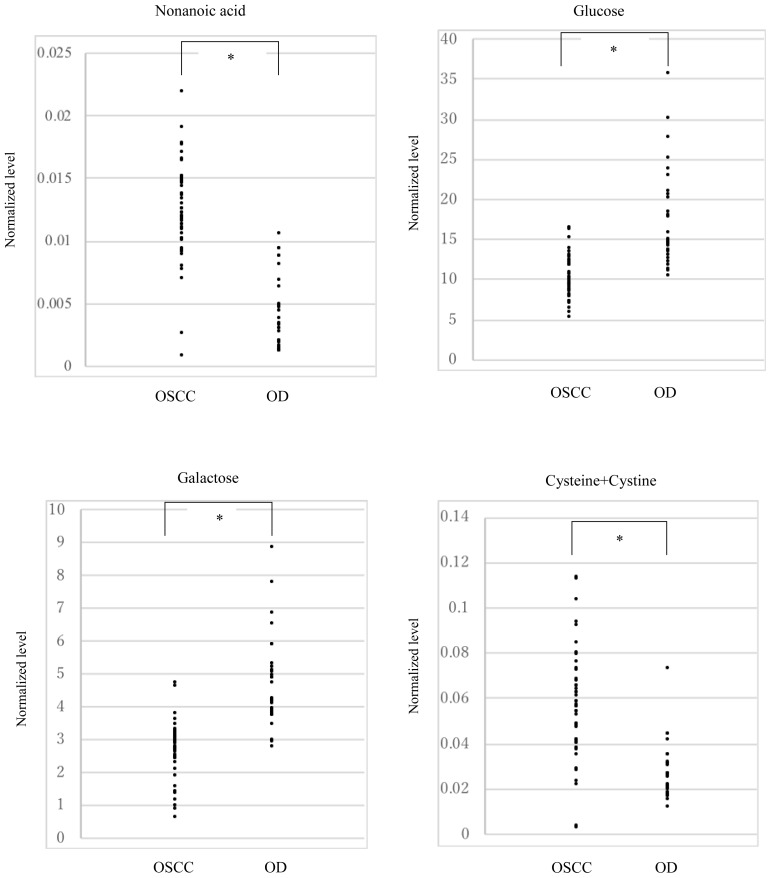
Figure 2.
Distribution of plasma levels of 4 biomarker candidates in the OSCC patients and OD patients.
The plasma levels of 4 biomarker candidates in the OSCC patients and OD patients are shown as closed circles. The Y-axis means the levels normalized by the internal standard. Asterisks means the significant differences between the OSCC patients and OD patients, and the P-values were calculated using the Student’s t-test.

