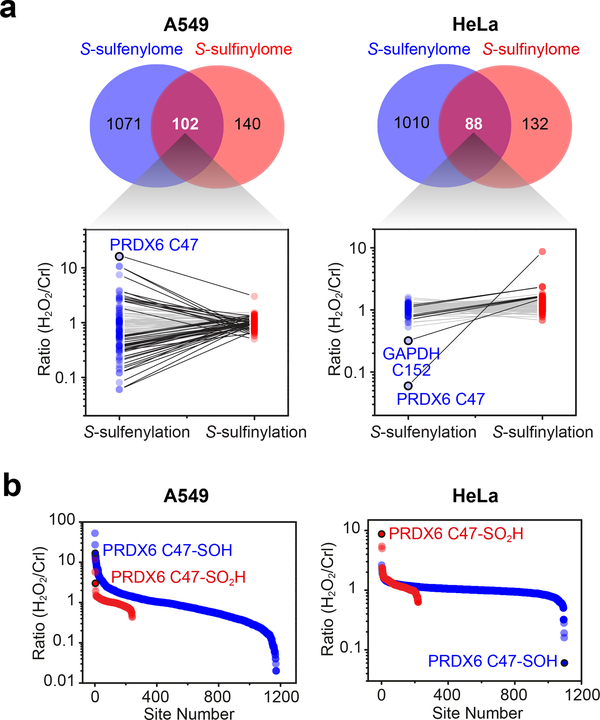
Figure 5 |. Comparison of S-sulfenylome and S-sulfinylome sites and dynamic fold-changes.
(a) Venn diagram showing overlap between the S-sulfenylome and S-sulfinylome. Ratios (H2O2 versus untreated control) obtained from common sites in the S-sulfenylome and S-sulfinylome dataset are plotted as line series and displayed on a log10 scale on the y-axis. Two-fold or smaller changes between –SOH and –SO2H are depicted with light grey lines; fold-changes greater than two are depicted in black. (b) Ratio (H2O2 versus untreated control) of S-sulfenylated and S-sulfinylated sites identified in the same cell line are plotted as a scatter graph and displayed on a log10 scale on the y-axis.

