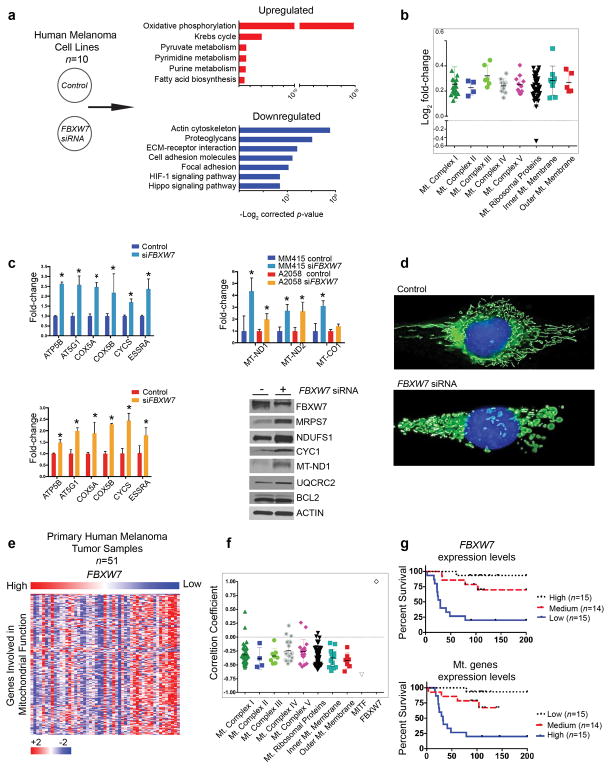
Figure 1. FBXW7 silencing enhances a mitochondrial gene transcription program.
(a) Human melanoma cell lines were transfected with either scrambled or FBXW7-specific pooled four distinct siRNAs (Dharmacon, Lafayette, CO), mRNA isolated, and subjected to RNA sequencing. Ten cell lines were examined: 501Mel, A2058, HT144, MeWo, MM415, MM485, SH4, SkMel3, WC119, and WM35. Differentially expressed genes between scrambled versus FBXW7 siRNA conditions were determined by using the limma software package (Law, Chen, Shi, & Smyth, 2014; Smyth, 2004). To identify functional pathways deregulated between the groups, the top 1000 up- and down-regulated genes were analyzed using DAVID (the Database for Annotation, Visualization, and Integrated Discovery). The x-axis represents the –log2 of the p-value and the y-axis the functional processes.
(b) Genes involved in mitochondrial function found as differentially expressed between scrambled versus FBXW7 siRNA (adjusted p-value ≤ 0.05) were grouped based on functional category. The x-axis represents mitochondrial functional groups and the y-axis the log2 fold-change.
(c) Two melanoma cell lines, A2058 and MM415, were transfected with scrambled or FBXW7-specific siRNA in triplicates, followed by total RNA isolation and qRT-PCR of genes for mitochondrial function, including those encoded by mitochondria (MT-ND1, MT-ND2, and MT-CO1). Selected proteins were validated by western blot using MM415 whole cell lysates. Densitometry analysis is indicated in Figure S1b.
(d) MM415 cells were transfected with scrambled or FBXW7-specific siRNA for 48 hours. Cells were seeded on rat-tail collagen I coated plates for 24 hours prior to the following indicated treatments. Mitochondria and nuclei were labeled with MitoTracker Green (100 nM) and Hoechst 33342 (20 mM) for 30 minutes at 37°C, respectively. Phenol red free media supplemented with 10% FBS, 2 mM L-glutamine, and antibiotics was used for all imaging performed on a Zeiss Imager.Z1 equipped with a N-Achroplan 40×/0.75 water immersion lens and an AxioCAM MRm digital camera. Images were captured using AxioVision 4.8 and Zeiss Zen software.
(e) Our previously published (Badal et al., 2017) RNA-Seq dataset of human primary melanomas (n=51) was queried for FBXW7 and mitochondrial genes. Heatmap represents supervised clustering based on FBXW7 mRNA expression levels (high to low, x-axis) and mitochondrial genes (y-axis).
(f) Pearson correlation coefficient values (+1 to −1, y-axis) for FBXW7 and genes regulating mitochondrial function (x-axis) were calculated from the RNA-Seq dataset, and are shown in a dot plot graph that also includes MITF.
(g) Kaplan-Meier survival curves of the patient cohort were examined for FBXW7 and genes regulating mitochondrial function. Survival curves showing clinical outcome of melanoma patients based on FBXW7 (top) and mitochondrial gene (bottom) expression levels are indicated. Samples are divided into three groups of similar size with high (n=15), medium (n=14), and low (n=15) expression levels.

