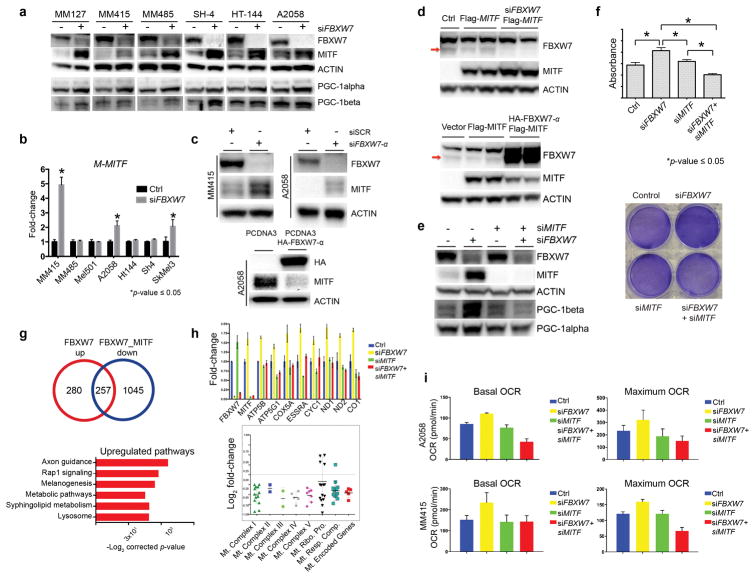
Figure 2. FBXW7 tumor suppressor modulates MITF, and MITF-dependent mitochondrial gene transcriptional program and oxidative metabolism.
(a) MITF protein levels were assayed using Western blotting (Pierce, Waltham, MA, USA) following transient transfection of either scrambled or FBXW7-specific siRNA in a panel of human melanoma cell lines. MM127, MM415, and MM485 harbor an NRASQ61 mutation whereas SH4, HT144, and A2058 melanoma lines have the BRAFV600E mutation. PGC-1alpha (Santa Cruz Biotechnology, Inc. Dallas, TX, USA) and PGC-1beta (Bethyl Laboratories, Inc. Montgomery, TX, USA) levels are shown. β-actin (Cell Signaling Technology, Inc., Danvers, MA, USA) was used as loading control. Densitometry is depicted in Figure S2.
(b) A panel of human melanoma cell lines were transfected with scrambled or FBXW7-specific siRNA and at 72h was processed for total RNA isolation and qRT-PCR for M-MITF. Expression levels of M-MITF were normalized to β-actin. The data plotted represent means ± standard deviations of three independent experiments. Significance is indicated by p-value ≤ 0.05.
(c) MITF levels were examined by Western blotting after silencing FBXW7 with FBXW7-α specific siRNA in MM415 and A2058 lines (top panel) and overexpressing FBXW7-α using HA-tagged FBXW7-α expression plasmid (bottom panel) in the A2058 human melanoma cell line. Experiments were performed at 72h. Densitometry is depicted in Figure S2.
(d) MITF levels were examined upon silencing of FBXW7 using FBXW7-specific siRNA in the presence of flag-tagged MITF expression vector or expression vector alone (top panel). Empty vector and flag-tagged MITF expression plasmid alone or together with HA-tagged FBXW7-α were transiently transfected in 293T cells. MITF protein levels were examined using Western blotting (bottom panel). β-actin was used as loading control. Densitometry is depicted in Figure S2.
(e) FBXW7 and MITF were silenced alone or in combination using gene-specific siRNAs in the MM415 human melanoma cell line (siMITF from Dharmacon, Lafayette, CO) followed by Western blotting. MITF, PGC-1alpha, and PGC-1beta levels were analyzed. β-actin was used as loading control. Densitometry is depicted in Figure S2. Densitometry is depicted in Figure S2.
(f) FBXW7 and MITF were silenced alone or in combination using gene-specific siRNAs in MM415 melanoma cells followed by XTT assay (Cell Signaling Technology, Inc., Danvers, MA, USA) to analyze cell viability using manufacturer’s instructions (top panel). The absorbance was read at 450nm in a 96-well plate reader. Representative crystal violet stainings are depicted in the bottom panel showing cellular density in the different experimental conditions.
(g) FBXW7 and MITF were silenced alone or in combination using gene-specific siRNAs in MM415 cells followed by total RNA isolation, library preparation (TruSeq RNA Library Prep Kit Illumina, San Diego, CA), and sequencing (Illumina NextSeq500, San Diego, CA), and analyzed as described previously (Badal et al., 2017). Differentially expressed genes for each condition were analyzed. Functional pathways and genes regulating mitochondrial function deregulated upon FBXW7 silencing that are dependent on MITF are selected and displayed.
(h) Validation experiment was performed using qRT-PCR on the same conditions using a selected number of genes involved in mitochondrial function.
(i) Oxygen consumption rate (OCR) was examined through the Seahorse technology using the manufacturer’s guidelines (Santa Clara, CA, USA). A2058 and MM415 melanoma cells were transfected with either scrambled, or gene-specific siRNAs for FBXW7 and MITF alone or in combination. At 72 hours the Mito Stress Test was performed and the data was normalized by a colorimetric assay.

