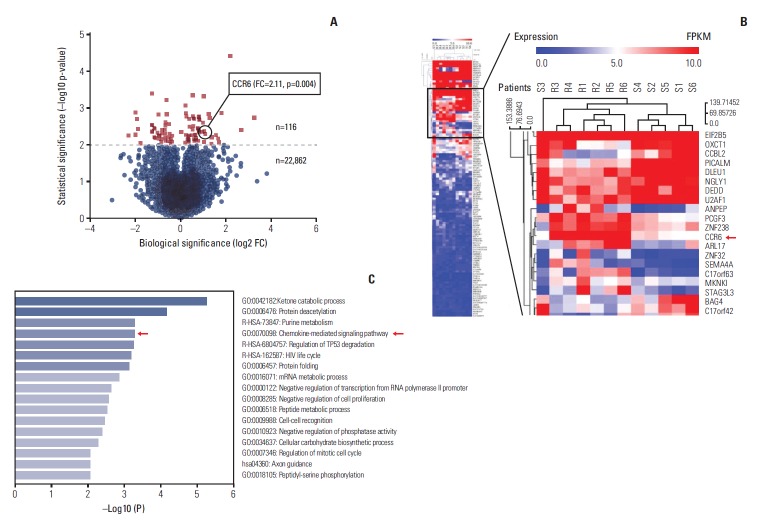
Fig. 1.
Profiles of RNA sequencing data. (A) Volcano plot of the 22,978 expressed genes. (B) Clustering heatmap of the 116 genes exhibiting obviously differential expression (p < 0.001). The C-C motif chemokine receptor 6 (CCR6) expression level was higher in the non-pathologic complete remission patients (R1-R6) than in the pCR patients (S1-S6). The fold change (FC) was 2.11 (p=0.004). (C) Heatmap of the pathway enrichment analysis. The top 5 enriched pathways were ketone catabolic process, protein deacetylation, purine metabolism, chemokine-mediated signaling pathway, and regulation of TP53 degradation.

