Fig. 1.

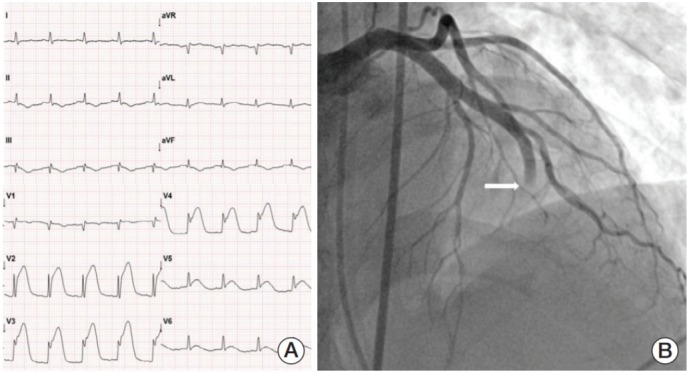
(A) Electrocardiogram showing ST segment elevation in leads V2 to V5. (B) Coronary angiography image showing complete occlusion at the mid-left anterior descending artery (arrow).

(A) Electrocardiogram showing ST segment elevation in leads V2 to V5. (B) Coronary angiography image showing complete occlusion at the mid-left anterior descending artery (arrow).