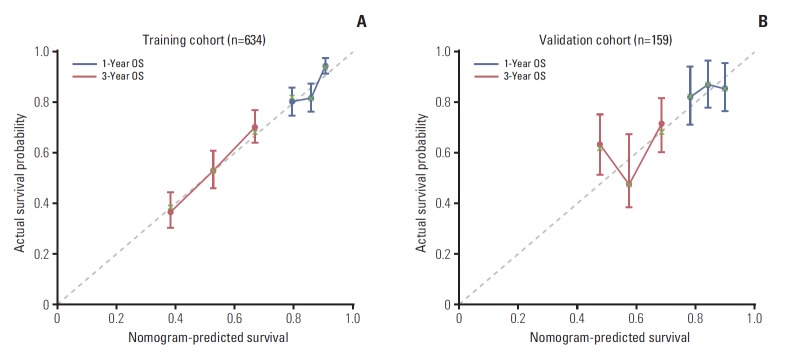
Fig. 3.
Calibration plots for predicting patient survival at 1 and 3 years in the training and validation cohorts. Calibration plots of survival probability in training (A) and validation (B) cohort. Probability of survival based on the nomogram has been listed on the x-axis, while actual probability of survival has been listed on the y-axis. OS, overall survival.

