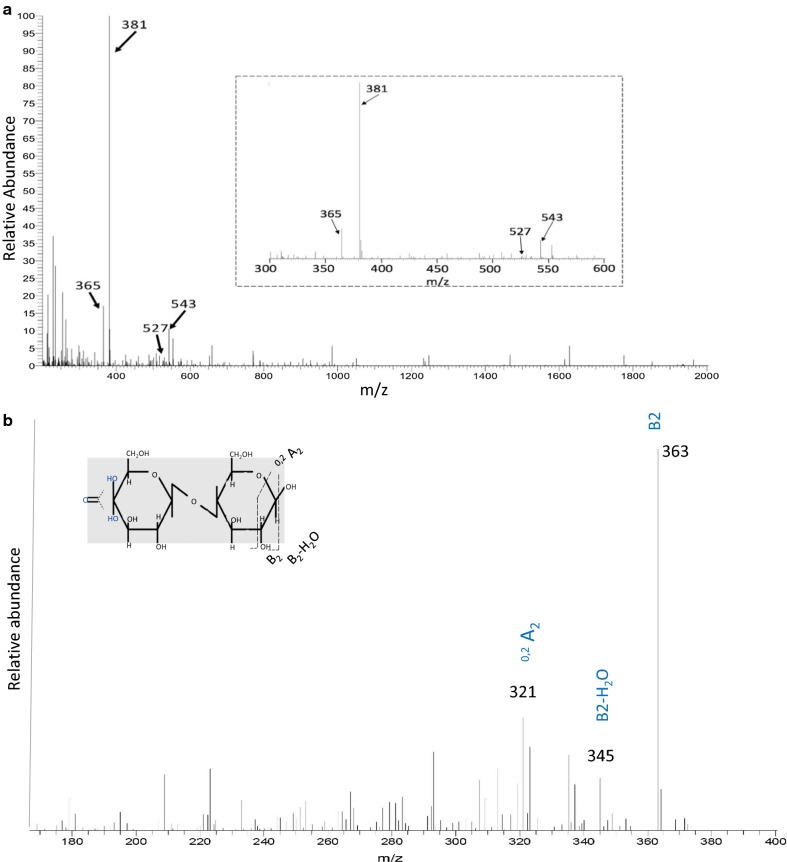
Fig. 4.
Mass spectrometry analysis of degradation products generated by AN1602 from cellohexaose. a The panel shows full spectrum of sample with peaks corresponding to native and oxidized cello-oligosaccharides after 24 h of cellohexaose degradation by AN1602.The inset shows the close-up of the spectra in the m/z 300–600. b MS/MS spectra of oxidized product with m/z 381 that was further fragmented. Masses are labeled based on expected fragmentation from the C4 oxidized product Glc4gemGlc. The inset shows the likely position of fragmentation products from Glc4gemGlc

