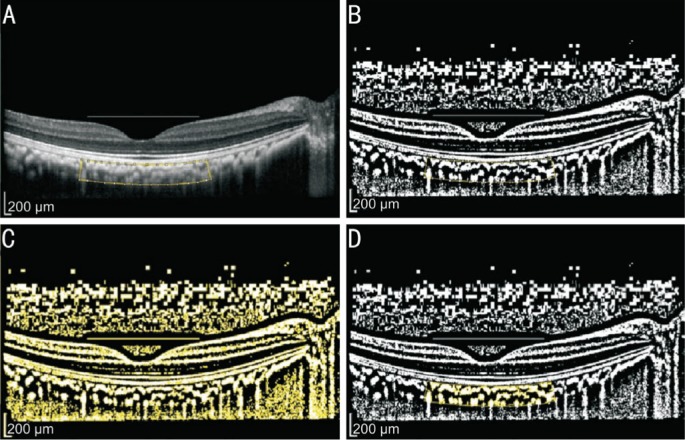
Figure 1. Image binarization for subfoveal choroid.

A: Original EDI-OCT image with selected region of interest (ROI); B: Binarized EDI-OCT image. Dark area representing luminal area and white area representing interstitial area; C: Red, green, blue (RGB) image. Dark area selected; D: Overlay image of the choroid was created in ROI.
