Fig. 2.
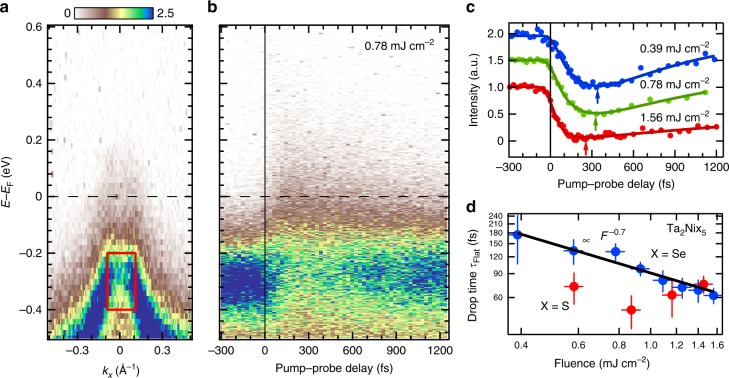
Collapse of the flat band in Ta2NiSe5. a Energy–momentum map of Ta2Ni(Se0.97S0.03)5 measured by using an XUV pulse (27.9 eV) before the arrival of the pump pulse (1.55 eV) at 100 K. b TARPES spectrum at the Γ point, obtained with a pump fluence of 0.78 mJ cm−2. c Temporal evolution of the integrated TARPES intensity in the red square shown in a for different pump fluences. The arrows indicate the minimum values of the spectral weight. d Extracted drop time of the flat band τFlat as a function of the pump fluence. Blue and red symbols corresponds to Ta2Ni(Se0.97S0.03)5 and Ta2NiS5, respectively. The error bars roughly correspond to the standard deviations

