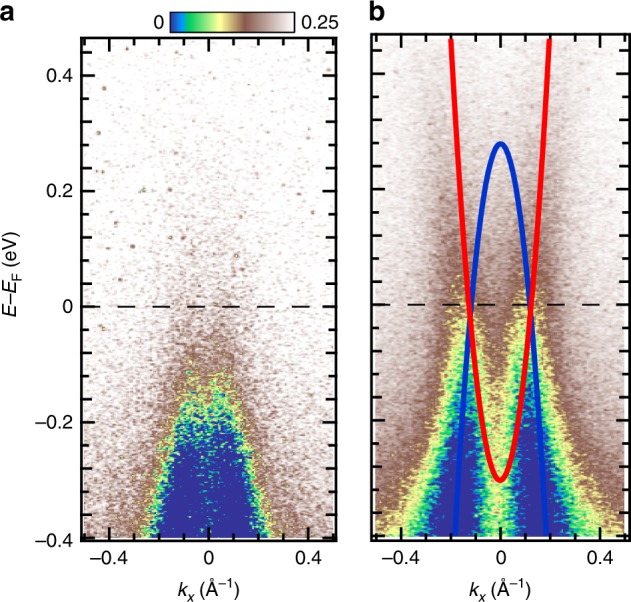
Fig. 4.

TARPES spectra of Ta2NiSe5 before and after pumping. a Energy–momentum (E–k) map before pumping, integrated in the time interval [−0.29, 0] ps. b Corresponding map of the transient states, integrated in [0, 1.2] ps. Red and blue parabolas indicate the electron and hole bands crossing EF in the non-equilibrium metallic state. These spectra were acquired with a pump fluence of 1.56 mJ cm−2. Note that due to the worse energy resolution (~250 meV) compared to the static ARPES measurements shown in Supplementary Fig. 2, the E–k map before pumping seems to have an intensity tail above EF (see also Fig. 3e)
