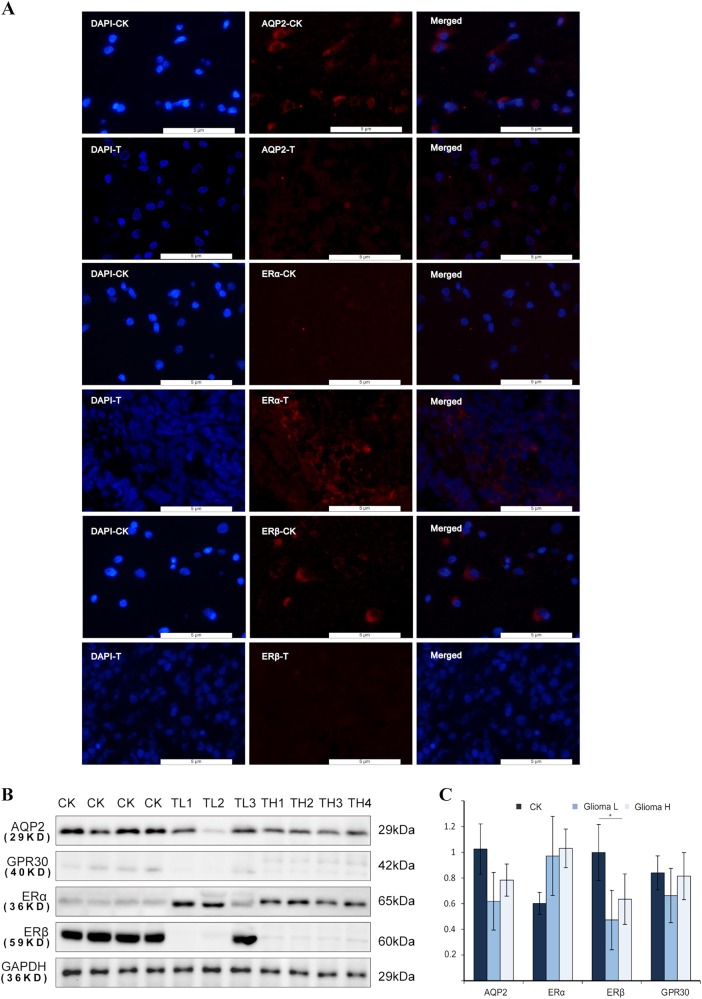
Fig. 1. Expression of AQP2 and ERs in glioma and glial tissues from patients.
Fluorescence staining analysis showed that AQP2, ERα, and ERβ were mainly located in the outer part of the nucleus (a). Target protein was stained in red. Cell nuclei were stained with DAPI. Western blot analysis demonstrated that the high expression levels of ERα, whereas low expression levels of ERβ and AQP2 were observed in glial cells compared to glioma cells (b, c). **P < 0.01 compared with the corresponding control. CK normal tissues, T tumor group, TL low-grade tumor, TH high-grade tumor

