Figure 1.
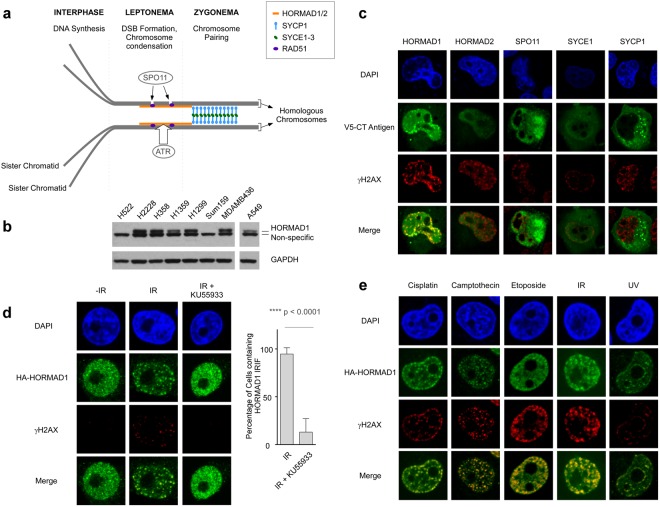
HORMAD1 redistributes to nuclear foci and co-localizes with the DNA DSB marker γH2AX in genotoxin-treated cancer cells. (a) Illustration depicting spatiotemporal organization of various CT antigens including HORMAD1, HORMAD2, SPO11, SYCE1 and SYCP1 during prophase I of meiosis (adapted from Bolcun-Filas and Schimenti, 2012). At the first meiotic division homologous chromosomes are joined via at least one crossover during the first prophase. Cross-overs are mediated via homologous recombination (HR) between the paired (homologous) chromosomes and the HR process is initiated via SPO11-induced DSB. A homology search juxtaposes the homologous chromosomes along their lengths and recombination is facilitated by the formation of the chromosome axis and the synaptonemal complex (SC). HORMADs associate with the unsynapsed chromosome axes and promote DNA DSB formation by the Spo11 endonuclease. (b) Immunoblot showing relative levels of HORMAD1 in various lung adenocarcinoma (H1299, A549, H2228, H358, H1359) and breast cancer (SUM159, MDA-MB436) cell lines. Please note that the protein sample in the A549 lane was from the same gel and immunoblot used to analyze all the other samples. An intervening ‘empty’ lane was excised from the digital image. (c) Plasmids encoding V5 epitope-tagged HORMAD1, HORMAD2, SPO11, SYCE1 and SYCP1 were transfected into H1299 lung carcinoma cells. 48 h later the transfected cells were irradiated (10 Gy) or sham-treated and 1 h later the subcellular distribution of each CT antigen in relation to γH2AX was analyzed by confocal microscopy. We used the microscopy image analysis software IMARIS (see Materials and Methods) to empirically measure and confirm that HA-HORMAD1 co-localized with γH2AX as shown in Supplementary Fig. S1. (d) HA-HORMAD1 was expressed in H1299 cells using a recombinant adenovirus. 24 h post-infection, some cultures were treated with 20 μM KU55933 for 1 h. Control and KU55933-treated cells were conditionally irradiated (10 Gy) and 1 h later the subcellular distribution of HA-HORMAD1 in relation to γH2AX was analyzed by confocal microscopy. The bar graph summarizes results of two independent experiments in which 100 cells were scored for HORMAD1 IRIF in the absence and presence of ATM inhibitor. Error bars indicate the standard deviation of results from two independent experiments. Quantification of Hormad1-53BP1 colocalization is presented in Supplementary Fig. 1B. (e) HA-HORMAD1 was expressed in H1299 cells using a recombinant adenovirus. 24 h post-infection, cultures were treated with various DNA-damaging agents. The subcellular distribution of HA-HORMAD1 in relation to γH2AX was analyzed by confocal microscopy at specific times (indicated in parentheses) after each genotoxin treatment: 5 μg/ml Cisplatin (6 h), 100 nM Camptothecin (6 h), 100 μM Etoposide (6 h), 10 Gy IR (1 h), 20 J/m2 UVC (6 h). For each genotoxin treatment the treatment conditions selected (dose, time) are ones that we and others have shown are associated with DSB formation. The average Pearson’s correlation coefficients for co-localization of Hormad1 with γH2AX in response to different treatments are as follows: 0.7 for cisplatin, 0.58 for Camptothecin, 0.72 for Etoposide, 0.67 for IR, and 0.53 for UV. The images shown in panel E are representative of nuclei with focal patterns that were observed in 2 independent experiments.

