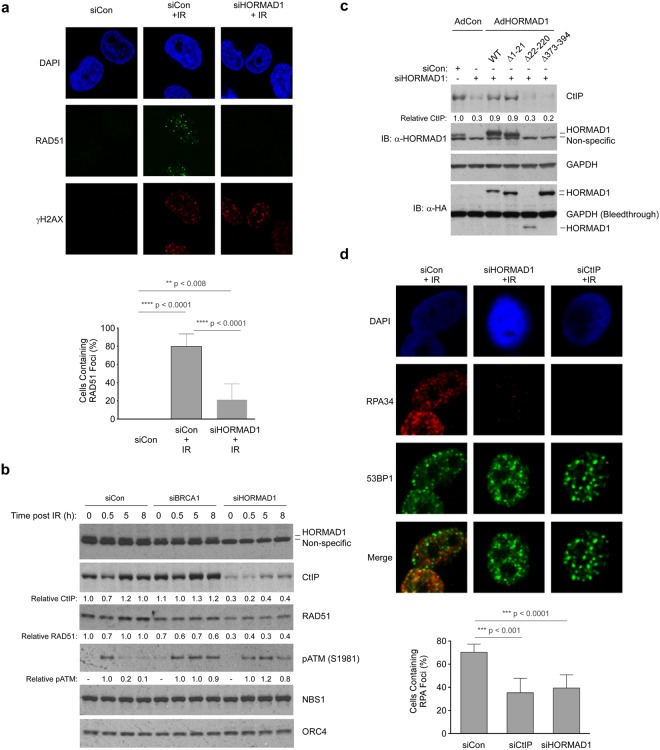
Figure 4.
HORMAD1 promotes DSB resection to promote HR. (a) H1299 cells were transfected with siCon or siHORMAD1. 48 h post-transfection cells were irradiated (10 Gy) and 1 h later nuclei were analyzed for RAD51 and γH2AX distribution using confocal microscopy. The number of cells containing RAD51 IRIF was reduced to 33% in HORMAD1-depleted cells when compared with control cultures (p < 0.001). Error bars represent the standard deviation and were derived from three independent experiments. (b) Replicate cultures of control, HORMAD1-depleted or BRCA1-depleted cells were irradiated (10 Gy). At different times post-IR, chromatin fractions were analyzed by SDS-PAGE and immunoblotting with the indicated antibodies. (c) H1299 cells were reverse transfected with siCon or siHORMAD1-5′UTR (which targets the untranslated region of the endogenous HORMAD1 mRNA but not the ectopically expressed HORMAD1 transcript). 16 h post-transfection cells were infected with advenovirus vectors encoding WT and mutant forms of HORMAD1. 48 hours post infection, cells were irradiated (10 Gy) and harvested 1 h later for SDS-PAGE and immunoblotting analysis with the indicated antibodies. (d) H1299 cells were transfected with siCon, siHORMAD1, or siCtIP. 48 h post-transfection cells were irradiated (10 Gy) and 1 h later nuclei were analyzed for RPA34 and 53BP foci using immunofluorescence confocal microscopy. 53BP1 focus formation was not significantly affected by HORMAD1 depletion. The experiment shown here was performed in parallel with the experiment presented in Supplementary Fig. 4. Immunoblots shown in Supplementary Fig. S4 validates efficient ablation of HORMAD1 and CtIP expression by these siRNAs. The histogram shows quantification of RPA IRIF data from multiple experiments. The percentage of cells containing RPA foci is counted. Depletion of CtIP or HORMAD1 significantly reduced the RPA- positive population of IR-treated cells by approximately 50% (relative to control siRNA transfected cultures). Error bars represent the standard deviation and were derived from three independent experiments.

