Figure 5.
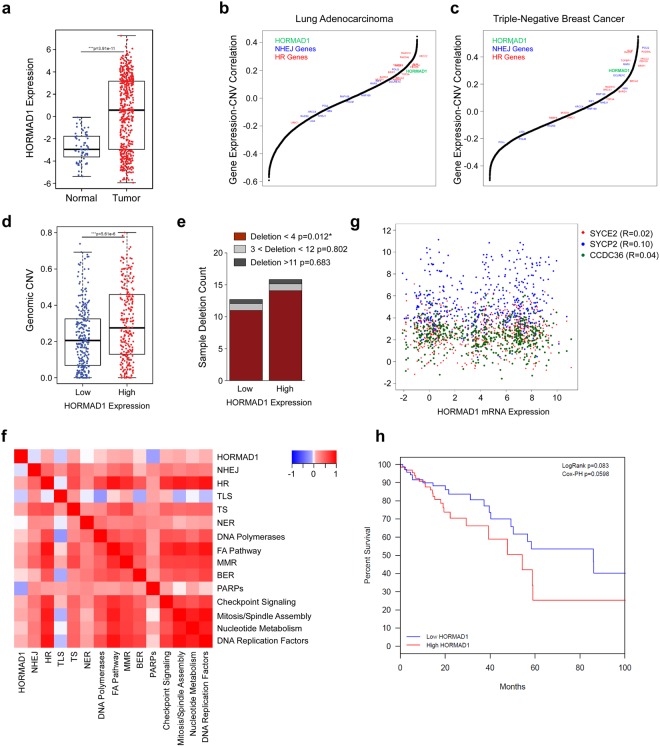
Genomic Correlates of HORMAD1 Expression in the TCGA Lung Adenocarcinoma (LUAD) dataset. (a) Boxplot of normalized HORMAD1 RNA expression in tumor and tumor-adjacent normal tissue samples in the LUAD samples. (b,c) Correlation between RNA expression and genomic copy number variation across all expressed. genes in LUAD and breast cancer samples respectively. HORMAD1 is indicated in green, other known HR genes are indicated in red, and NHEJ genes are indicated in blue. (d) Boxplot of genomic copy number variations by high vs low HORMAD1 expression. (e) Barplot of deletion frequency and length by high vs low HORMAD1 expression. (f) Heatmap of correlations between HORMAD1 and gene signature scores across DNA repair pathway gene set. (g) Plot showing correlation of HORMAD1 RNA expression and other CTAs in the LUAD dataset, showing no significant correlation between their expressions. (h) Kaplan-Meier plot of LUAD patients stratified by HORMAD1 expression.

