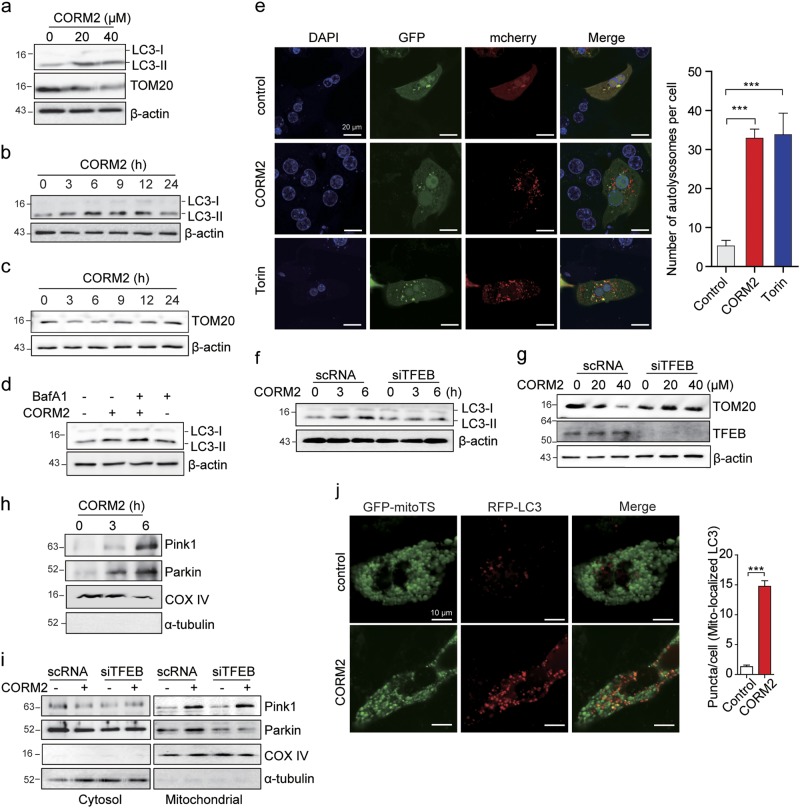
Fig. 3. CO enhances mitophagy through TFEB activation.
a–c Primary hepatocytes were treated with CORM2 for 6 h at the indicated concentrations (a) or for the indicated times at 20 μM (b and c). The levels of LC3B-II and TOM20 were determined by immunoblotting. d Primary hepatocytes were treated with CORM2 (20 μM) in the presence of bafilomycin A1 (Baf A1), autophagy flux inhibitor. The cells were collected and cell lysates were subjected to immunoblotting to detect the expression of LC3B. e Primary hepatocytes were transfected with mcherry-GFP-LC3 for 24 h. After transfection, cells were treated with CORM2 (20 μM) or Torin 1 (1 μM) for 6 h, and analyzed by confocal fluorescence microscopy. Scale bar, 20 μm. The number of autolysosomes (red puncta) per cell (n = 10) was counted. Data are shown as mean ± SEM. ***P < 0.001 vs. control. f, g Primary hepatocytes were transfected with scrambled RNA (scRNA) or siRNA against TFEB (siTFEB) for 24 h, and then treated with CORM2 (20 μM) for the indicated times (f) or at the indicated doses for 6 h (g). The levels of LC3B-II, TOM20, and TFEB were determined by immunoblotting. h Mitochondrial fractions isolated from primary hepatocytes treated with CORM2 (20 μM) for the indicated times were analyzed by immunoblotting using antibodies against PINK1 and Parkin. i HepG2 were transfected with scRNA or siTFEB for 24 h and then treated with CORM2 (20 μM) for 6 h. Cells were fractionated into cytosol and mitochondria, and the levels of PINK1 and Parkin were analyzed by immunoblotting. Fraction quality was verified by immunoblotting with markers for the cytoplasm (α-tubulin) and mitochondria (cytochrome IV oxidase, COX IV). j Left panel, primary hepatocytes were transfected with GFP-mitoTS and RFP-LC3 for 24 h. After transfection, cells were treated with CORM2 (20 μM) for 3 h and analyzed by confocal fluorescence microscopy. Scale bar, 10 μm. Right graph, GFP-LC3 punctate structures associated with mitochondria were quantified. Values represent mean number of puncta counts per cell, n = 20 cells from two independent experiments. ***P < 0.001 vs. control

