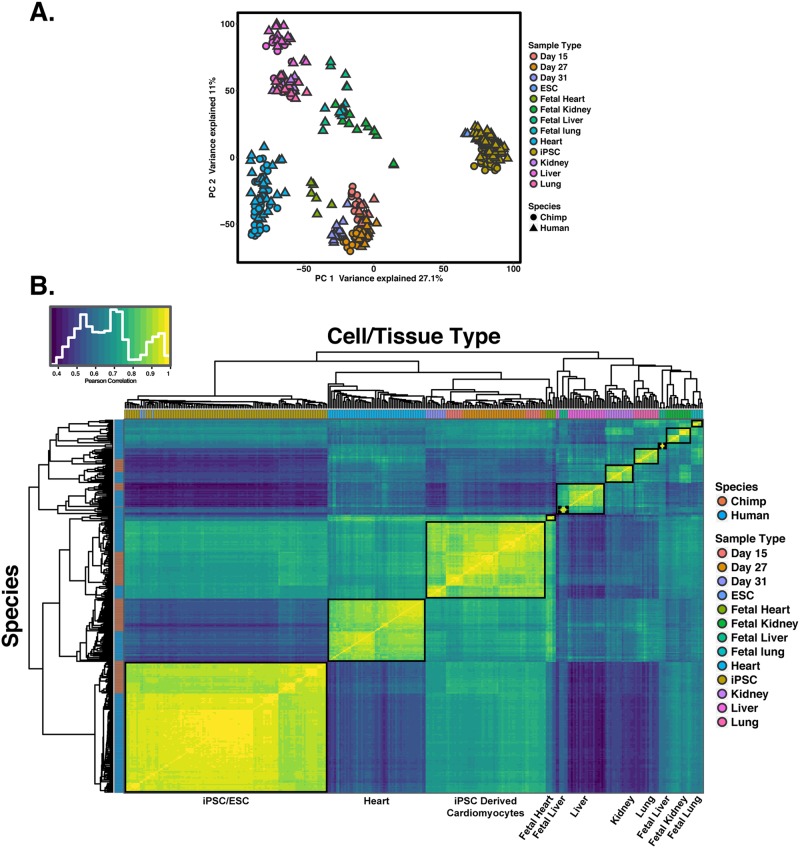
Figure 6.
Global patterns of gene expression using multiple adult and fetal tissues from public datasets. (A) Normalized log2(RPKM) expression measurements for all genes projected onto the axes of the first two principal components. Color indicates cell or tissue type. Shape represents species. PC1 and PC2 are both strongly associated with cell or tissue type. (B) Heat map of the Pearson’s correlation matrix of normalized log2(RPKM) gene expression values from 335 samples for 15,829 orthologous genes. Each square represents the Pearson’s correlation of the normalized expression values between two samples.

