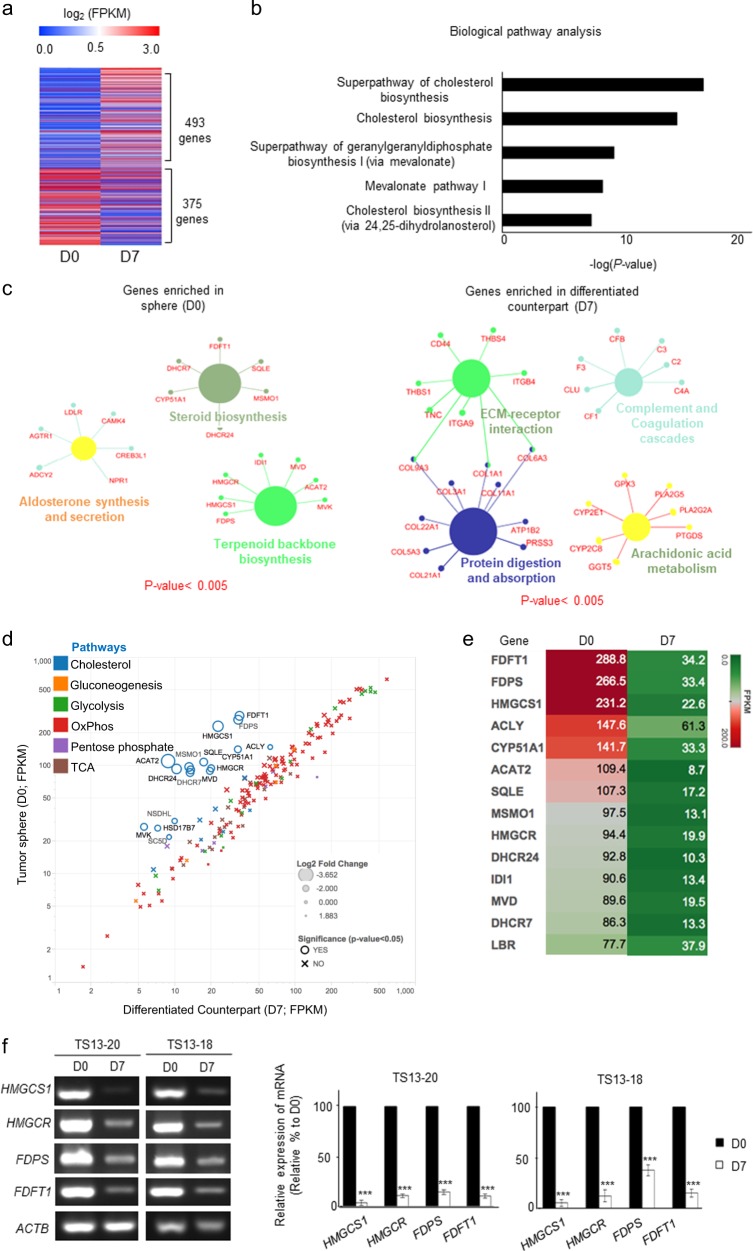
Fig. 2. The most differentially expressed genes (DEGs) in sphere and differentiated cells are cholesterol pathway genes.
a DEGs between TS13-20 spheres (D0) and their differentiated counterparts (D7) were analyzed by RNA sequencing. Genes with expression changes more than four-fold are shown. DEGs are listed in Supplementary Table S2. b The cholesterol biosynthesis-related pathway was the dominant pathway altered in sphere (D0) cells according to functional enrichment analysis using FunRich (http://www.funrich.org). The top five pathways are presented. c Down- and upregulated DEGs were subjected to gene network analysis using Cytoscape (http://www.cytoscape.org). Gene networks with P values < 0.005 are shown. d The change in the mRNA expression of various metabolic pathway genes between D0 and D7 cells was analyzed. Cholesterol-related genes were the only metabolic genes that varied between the two samples. The marker size is proportional to the log2-fold change (D0/D7). e Heatmap showing a clear distinction between the cholesterol pathway-related gene expression levels in the two samples. f Changes in the expression of cholesterol pathway genes were validated by RT-PCR and real-time quantitative PCR. The data are presented as the means of three independent experiments. ***P < 0.001 relative to D0

