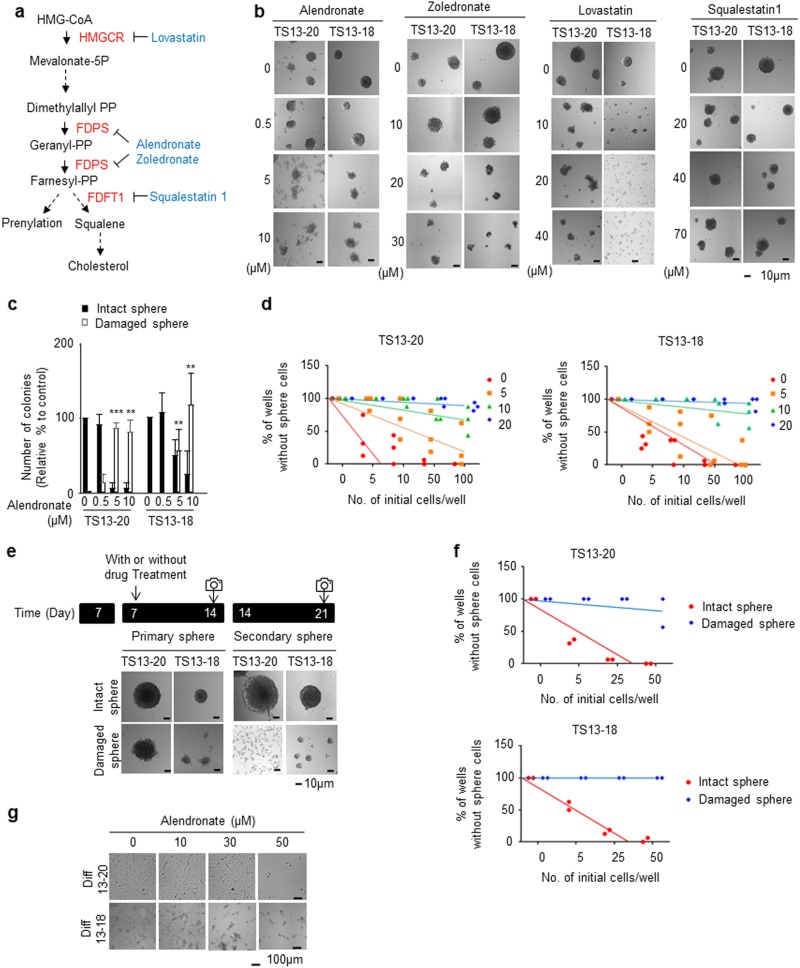
Fig. 3. Pharmacological inhibition of farnesyl diphosphate synthase (FDPS) suppresses glioblastoma sphere formation.
a Abbreviated representation of cholesterol synthesis. Black, metabolite; red, key enzymes; blue, FDA-approved drugs that inhibit the indicated enzymes. b, c Alendronate inhibited glioblastoma sphere formation. Patient-derived glioblastoma sphere cells (TS13-20 and TS13-18) were treated with the indicated concentrations of drugs for 7 days. Bright field images of cells were taken with a Cytation 3 microplate reader (Bio-Tek, Winooski, VT, USA). b A representative image of the experiment is shown. c Intact and damaged spheres were quantified (n = 3). ***P < 0.001, **P < 0.01, *P < 0.05, and NS P > 0.05 relative to the number of spheres cultured under no-drug-treatment conditions. d Limiting dilution assays were performed in TS13-20 and TS13-18 cells treated with the indicated concentration of alendronate. e Damaged spheres did not form secondary spheres. TSs cultured for 7 days were treated with or without alendronate for 7 days. Then, all sphere cells (intact and damaged) were subjected to secondary sphere formation. Bright field images of cells were taken 7 days after secondary culture using Cytation 3; a representative image of at least three independent experiments is shown. f Limiting dilution assays were performed with intact and damaged sphere cells under the same conditions described in (e). g Alendronate was less effective in differentiated cells than in sphere cells. Glioblastoma sphere cells (TS13-20, TS13-18) were differentiated for at least 7 days. Differentiated cells (Diff13-20, Diff13-18) were treated with the indicated concentration of alendronate for 7 days. Bright field images were obtained using a JuLI Br system (NanoEnTek, Inc., Korea); a representative image of at least three independent experiments is shown

