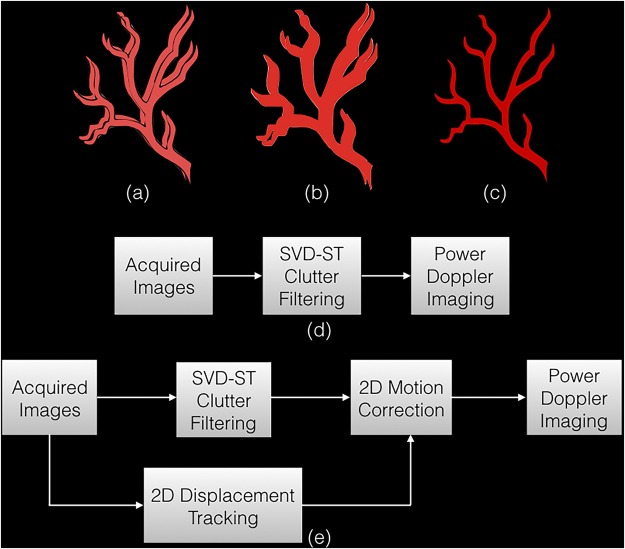
Figure 1.
An illustration to display the impact of motion on blood flow visualization. (a) displays the clutter filtered blood flow signal in two example Doppler frames, spatially mis-registered due to motion. On estimating the power Doppler image using Eqn. (2), the final image is blurred with appearance of shadow vessels. (c) displays the final image expected upon motion correction, where the Doppler signals coherently integrate to produce a more stronger signal with reduced motion artifacts. Specifically, (b) and (c) are obtained using the approach outlined in (d) and (e), respectively.

