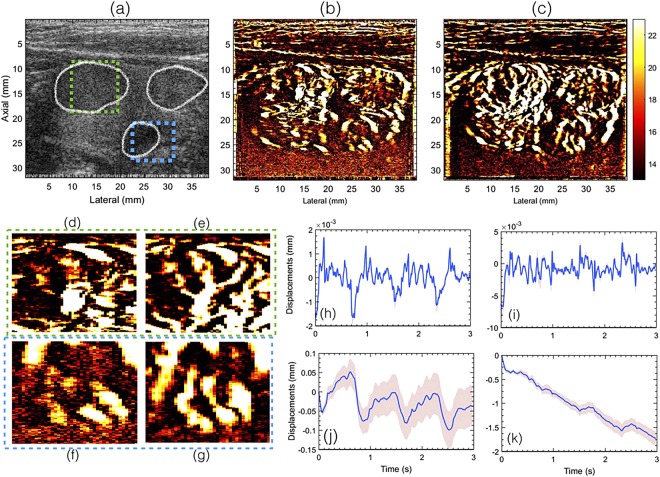
Figure 2.
Displays the plane wave B-mode sonogram (a) and the corresponding PD images without (b) and with motion (c) correction. The outline of the thyroid nodules are indicated in white in the B-mode sonogram (a). Figures (d,f) show zoomed insets obtained from (b). Figures (e,g) show zoomed insets obtained from (c). The green and blue outline corresponds to images in (d,f) and (e,g), respectively. Figures (h,i) and (j,k) visualize the axial and lateral displacements, respectively. Further, (h,i) displays the displacements associated with every consecutive frame, and (j,k) displays the total accumulated displacements, with reference to the first frame in the ensemble. The continuous error-band (red) displays ±1 standard deviation from the mean. For the sake of clarity in visualizing the small blood vessel structures, the green and the blue ROIs were indicated in the B-mode sonogram.

