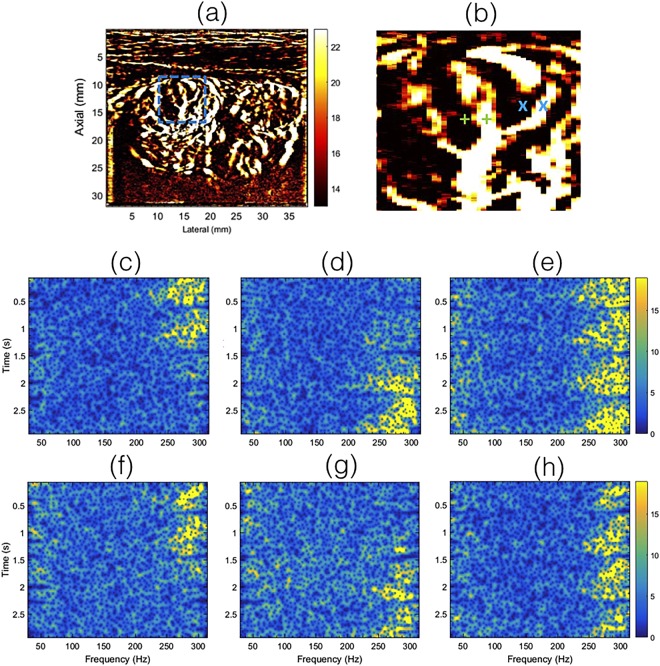
Figure 7.
Displays the time-frequency spectrogram associated with the clutter filtered Doppler ensemble, prior to PD computation. Each time-frequency spectrum was calculate at a single-pixel spatial location, indicated in zoomed inset (b), obtained from the PD image (a). Specifically, figures (c–e) and (f–h) corresponds to the green ‘+’ and blue ‘x’ in (b), respectively. The time-frequency spectrums displayed in (c,f) and (d,g) were obtained without motion correction. Data displayed in (c,d) corresponded to the locations indicated by the left and right green ‘+’ in (b), respectively, prior to motion correction. Similarly, the data displayed in (f,g) corresponded to the locations indicated by the left and right blue ‘x’ in (b), respectively, prior to motion correction. Each of the green ‘+’ and blue ‘x’ pixel pairs were separated by 4 pixels. The time-frequency spectrums for the motion corrected data were displayed in (e,h), obtained from the location indicated by the right ‘+’, ‘x’ markers in (b), respectively.

