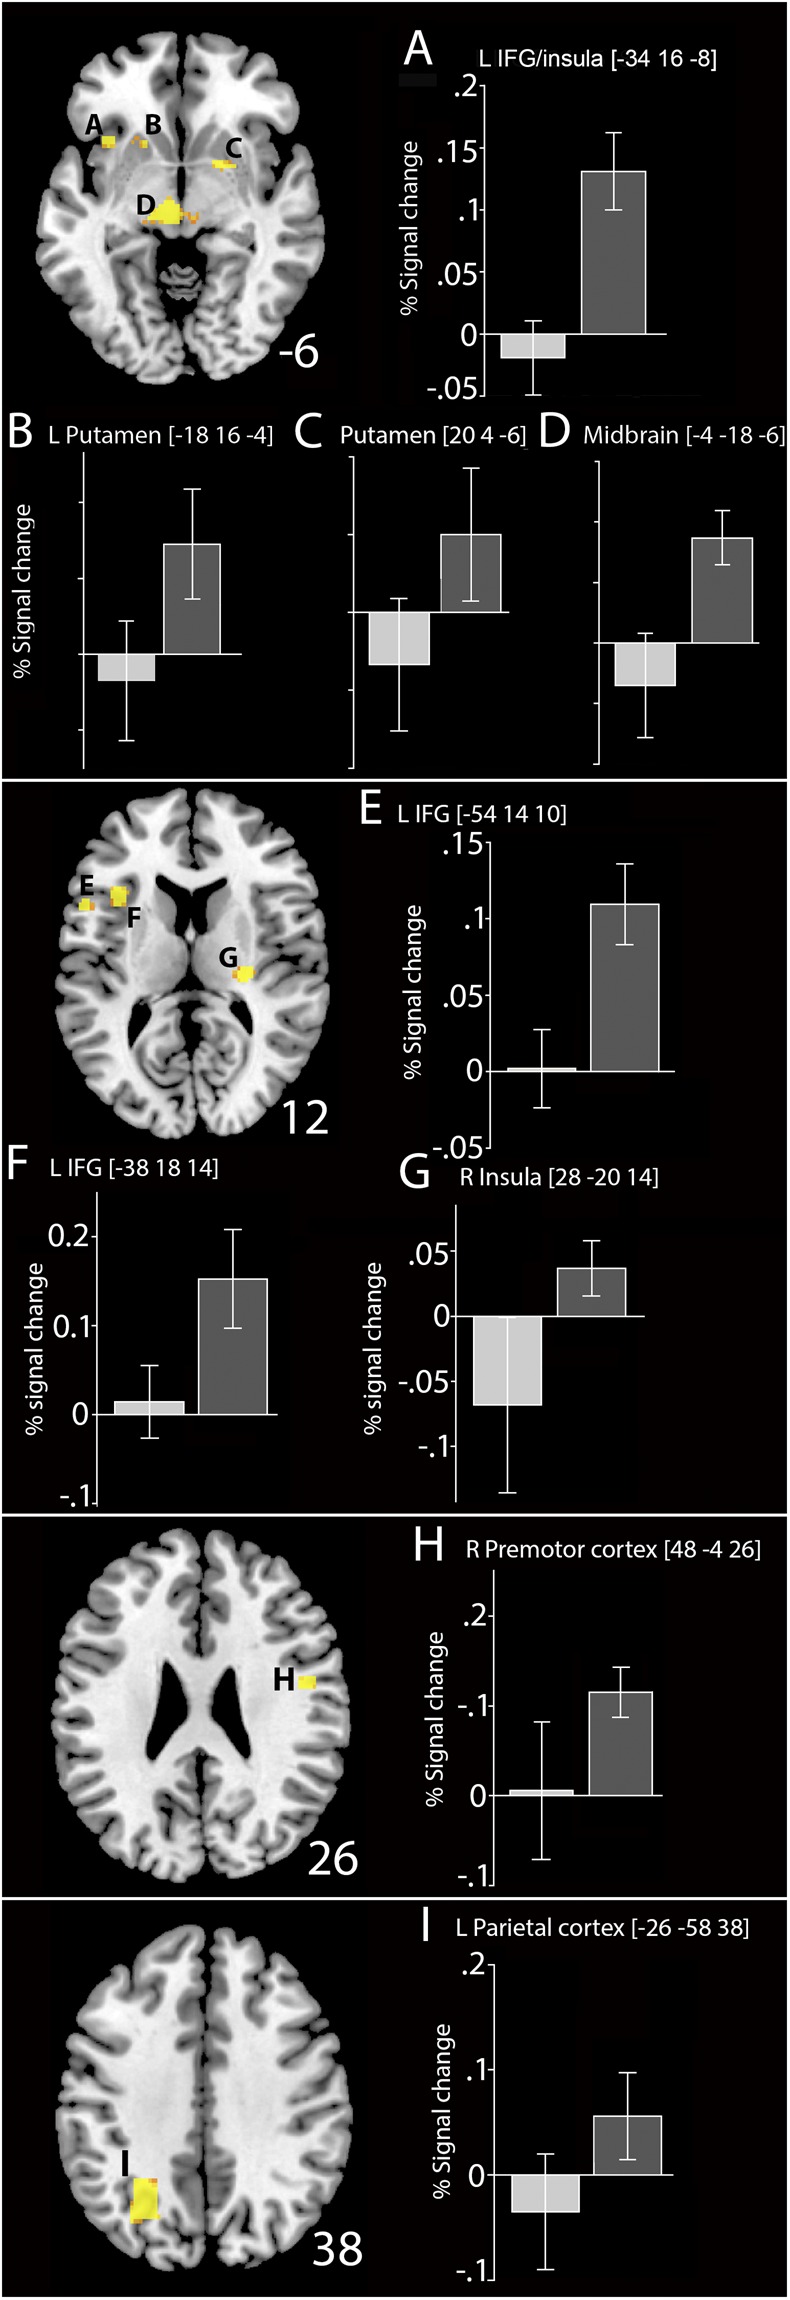
Figure 3.

fMRI results. Differences in BOLD activity in individuals in the interference group (high-interference context; dark gray bars) and the control group (low-interference context; light gray bars). Between-group whole-brain results are based on first-level contrast of non-recent negative probes and positive probes (for display purposes, thresholded at P < 0.001 uncorrected). BOLD activation (% signal change) extracted from functional ROIs around the local cluster maxima. Error bars indicate standard means across participants.
