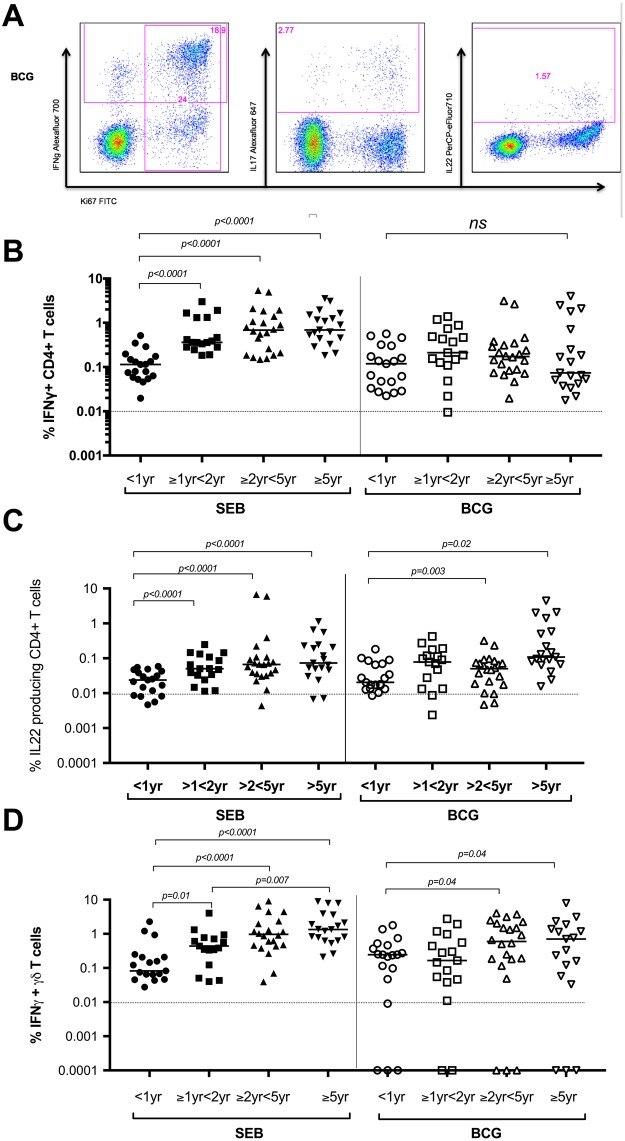
Figure 1.
Children of all ages have measurable BCG specific CD4+ IFNγ responses, but non-specific responses increase with increasing age. (A) Flow cytometric plots from a representative individual infant showing intracellular IFNγ, IL17 or IL22 cytokine secretion by BCG stimulated CD4+ T cells are shown. (B) Frequencies of IFNγ producing CD4+ T cells, (C) IL22 producing CD4+ T cells or (D) IFNγ producing γδ T cells, as detected by an intracellular cytokine assay following stimulation of whole blood with SEB or BCG for 20 hours, are shown. Horizontal bars represent median values. The dotted line represents a cut-off of 0.01% for a significant response. The Mann-Whitney test was used to calculate p values.

