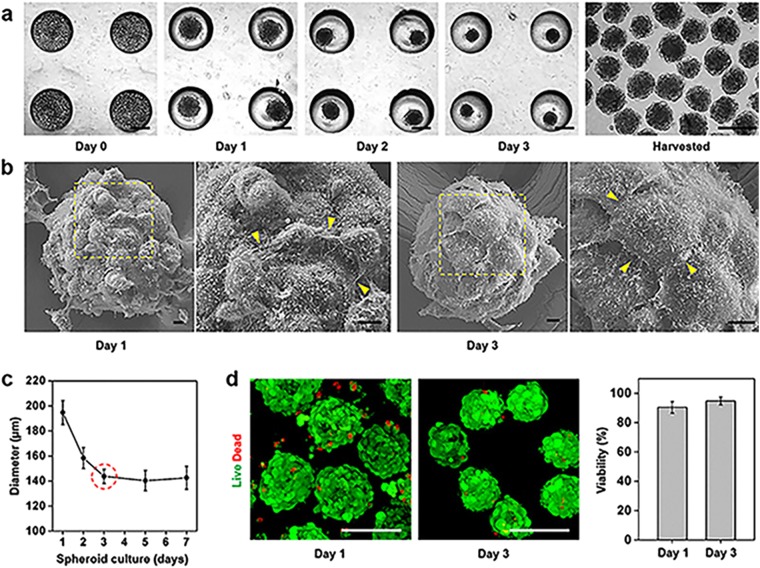
Figure 2.
Morphologies and viabilities of PD-MSC spheroids. (a) Optical images of PD-MSC spheroids forming in concave microwells over time. Scale bars: 200 µm. (b) SEM images of spheroids on days 1 (left) and 3 (right) with magnified surface images showing differences in the junctions between neighboring cells (arrowheads). Scale bars: 10 nm. (c) Analysis of the diameter of PD-MSC spheroids over time. (d) Cell viabilities in spheroids cultured for 1 and 3 days. Scale bars: 200 µm. The quantification data (right) are expressed as the mean ± SE (n = 25).

