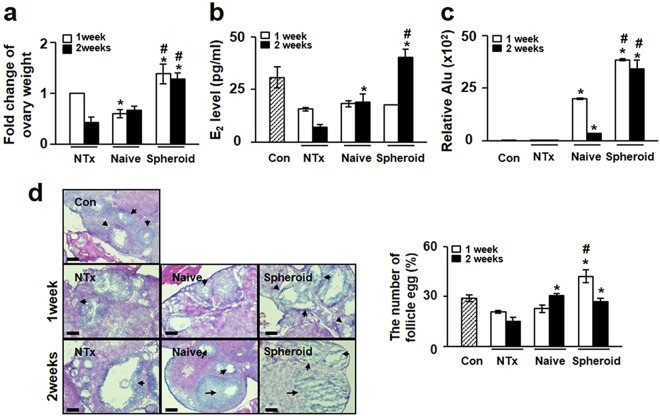
Figure 3.
Therapeutic effect of PD-MSCs in ovariectomized (Ovx) rats. (a) The graph represents the ratio of ovary weight to body weight in Ovx rats transplanted with naïve or spheroid PD-MSCs. (b) E2 levels in plasma samples from transplanted and non-transplanted rats. (c) Quantification of the expression of human-specific Alu sequences in rat ovary tissues engrafted with naïve PD-MSCs or spheroidal PD-MSCs, as assessed by qRT-PCR. (d) Histological analysis of ovary tissues obtained from Ovx rats transplanted with or without naïve or spheroidal PD-MSCs (left). Quantification of follicles in rat ovary tissues according to PD-MSC transplantation (right). The arrows indicate follicles below 100 µm in size. Scale bar: 20 nm. The data are expressed as the mean ± SE. Symbols: *represent a significant difference compared to the NTx group (p < 0.05); #represents a significant difference between the Naïve and Spheroid groups (p < 0.05). Abbreviations: Ovx, ovariectomized (unilateral); Con, sham-surgery group; NTx, non-transplanted Ovx model; Naïve, naïve PD-MSC-transplanted group; and Spheroid, spheroid PD-MSC-transplanted group.

