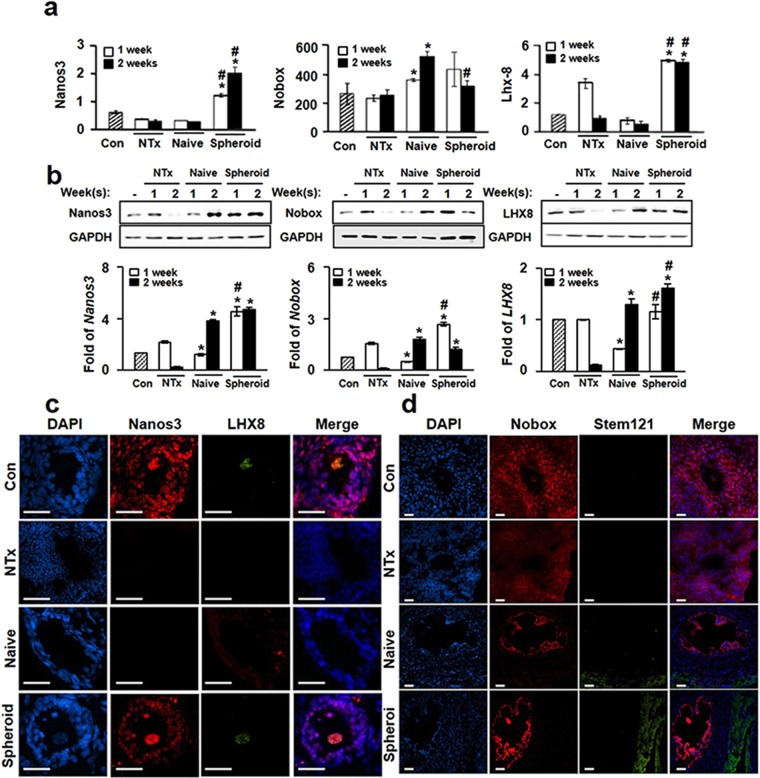
Figure 4.
Analysis of oogenesis-related gene expression in ovary tissues of Ovx rats with or without PD-MSC transplantation. (a) The mRNA expression levels of Nanos3 (left), Nobox (middle) and Lhx8 (right) were assessed with qRT-PCR. (b) The protein expression levels of Nanos3, Nobox and Lhx8 were assessed with Western blot analysis. (c) Localization of Nanos3 and Lhx8 in rat ovary tissues, as assessed by double immunofluorescence (red LNanos3; green = Lhx8; blue = nuclei, DAPI). Scale bar: 20 nm (x200 original magnification). (d) Localization of Nobox and stem121 in rat ovary tissues, as assessed with double immunofluorescence (red = Nobox; green gstem121; blue tenuclei, DAPI). Scale bar: 20 µm (x100 original magnification). The data are expressed as the mean ± SE. Symbols: *represents a significant difference compared to the NTx group (p < 0.05); and #represents a significant difference between the Naïve and Spheroid groups (p < 0.05). Abbreviations: Ovx, ovariectomized (unilateral); Con, sham-surgery group; NTx, non-transplanted Ovx model; Naïve, naïve PD-MSC-transplanted group; and Spheroid, spheroid PD-MSC-transplanted group.

