Fig. 1.
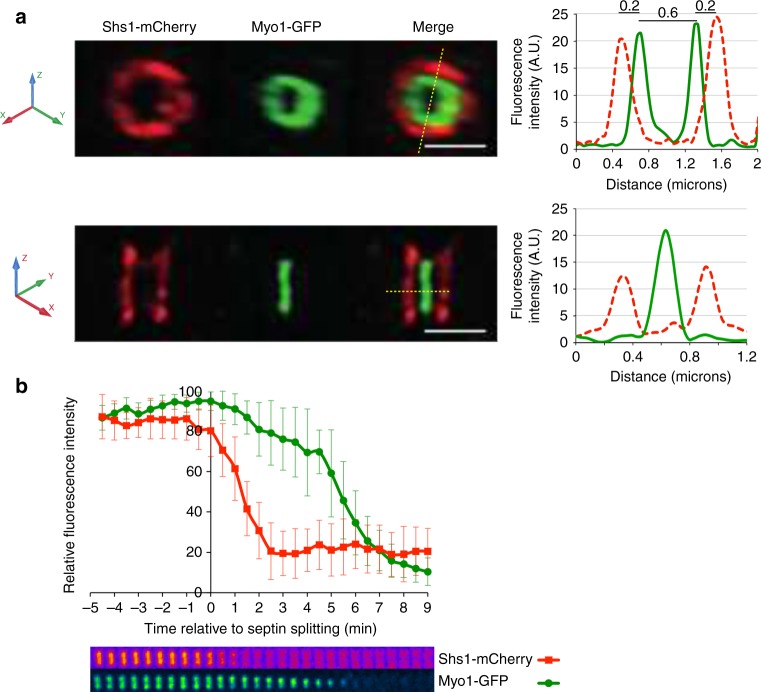
Septin ring splitting and CAR constriction are spatially and temporally separated events. a Logarithmically growing cells expressing Shs1-mCherry and Myo1-GFP were fixed and processed for SIM. The image shows an example of split septin rings sandwiching the CAR. Scale bar: 2 μm. Graphs show the quantification of fluorescence intensities along the yellow dotted line in the merge. Dotted red line: Shs1-mCherry; green line: Myo1-GFP. A.U.: Arbitrary Units. b Same cells as in a were imaged live every min through their cell cycle. Quantification of fluorescence intensities associated to Shs1-mCherry and Myo1-GFP around the time of septin ring splitting (time 0). Fluorescence intensity associated to septin and myosin II has been quantified by ImageJ in cells undergoing cytokinesis (graph; red squares: Shs1-mCherry; green circles: Myo1-GFP) and then related to the highest fluorescence intensity of each structure in a given cell. Plots show average values (n = 15). Error bars: s.d. Cropped images beneath the graph show the behavior of septin ring and CAR during this time frame in one representative cell. Shs1 was pseudocolored with the Fire plugin of Image J to reflect signal intensity (orange/red signals mean higher fluorescence intensity than magenta signals)

