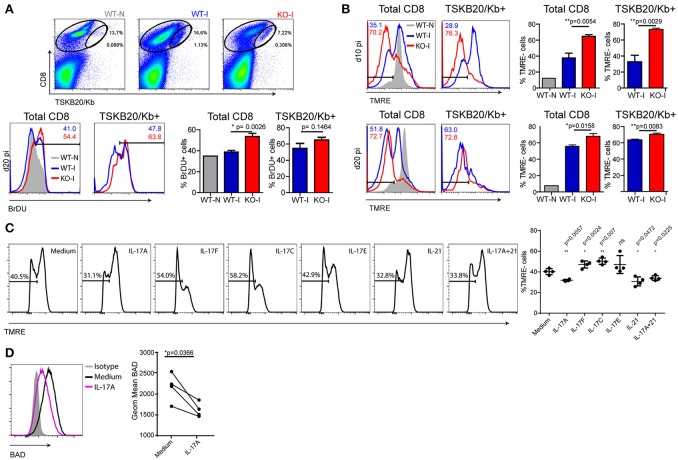
Figure 2.
IL-17RA signaling during T. cruzi infection promotes survival of CD8+ T cells. (A) Representative dot plots of CD8 and TSKB20/Kb staining and representative histograms of BrDU in cell suspensions from the spleen of WT and KO mice at 0 dpi (WT-N) and 20 dpi (WT-I and KO-I) and within the indicated total and TSKB20/Kb+ CD8+ T cell gates. Numbers in the histograms indicate the frequency of BrDU+ cells from the corresponding colored group. Histograms are representative of one out of five mice. Bars in the statistical analysis represent data as mean ± SD, N = 5 mice. P values were calculated with two-tailed T test. (B) Representative histograms of TMRE staining in total (left) and TSKB20/Kb+ (right) CD8+ T cells from the spleen of WT and IL17RA KO mice at 10 dpi (top) and 20 dpi (bottom). Numbers indicate the frequency of TMRE- (apoptotic) cells in total and TSKB20/Kb+ CD8+ T cells from the corresponding colored group. Gray tinted histogram show staining in CD8+ T cells from non-infected WT mice (WT-N). Histograms are representative of one out of five mice. Bars in the statistical analysis represent data as mean ± SD, N = 5 mice. P values were calculated with two-tailed T test. (C, D) Representative histograms of TMRE (C) and BAD (D) stainings in cultures of purified CD8+ T cells activated with coated anti-CD3 and anti-CD28 in the presence of the indicated cytokines. Statistical analysis in (C) shows the frequency of TMRE- (apoptotic) cells in each biological replicate (N = 4 mice) and the mean ± SD. P values calculated with paired two-tailed T test (ns, not significant). Statistical analysis in (D) represent protein expression as the geometric mean of fluorescence intensity in each replicate (N = 4 mice). Lines link paired samples. P values calculated with paired two-tailed T test. Data in (A-D) are representative of three and two independent experiments, respectively.

