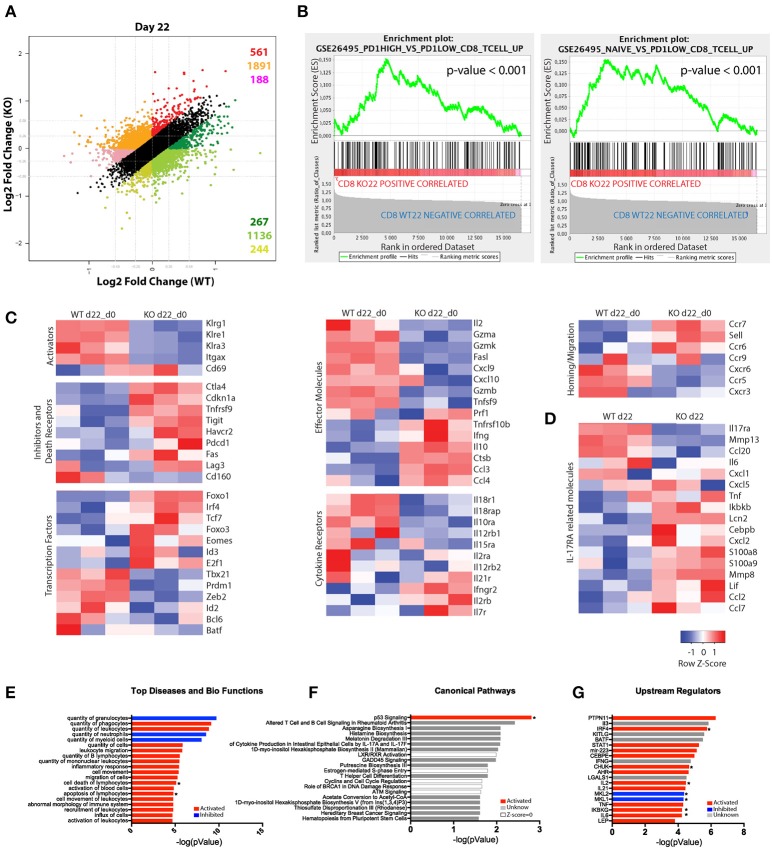
Figure 3.
Substantial differences in the gene-expression profile of CD8+ T cells from T. cruzi-infected IL-17RA KO and WT mice. (A–F) Microarray analysis of purified CD8+ T cells from infected WT (WT-I) and IL-17RA KO (KO-I) mice (22 dpi) and non-infected controls (WT-N and KO-N). N = 3 mice per group. (A) Dot plot displaying the number of genes that show a significant ≥1.2-fold difference in fold change expression of WT-I and KO-I relative to non-infected counterparts. Colors indicate sets of genes with different expression patterns. (B) Top two enrichment plots in KO-I (p < 0.001) determined by supervised analysis of all infection induced genes in WT-I and KO-I using GSEA26495 and GSEA41867 (MSigDB C5BP) signature gene sets. (C) Heat maps of expression of selected genes according to categories relevant to CD8+ T cell biology. The gene expression values of each sample were normalized by division to the average values of the corresponding samples from non-infected counterparts. (D) Heat map of expression of genes encoding molecules associated to IL-17RA signaling. Gene expression values represent non-normalized data from 3 mice. (E–G) IPA of genes induced by the infection but showing significantly higher expression in IL-17RA KO mice (red genes in A). Top 20 “Diseases and Bio-functions” (E), “Canonical pathways” (F), and “Up-stream regulators” (G) that were most significantly altered (P < 0.05 with Fischer's exact test) in KO mice are shown. The activation Z-score was calculated to predict activation (red), inhibition (blue), categories where no predictions can be made and unknown results (with Z-score close to 0). Categories significantly activated or inhibited according to Z-score are marked with a star.

