Figure 4.
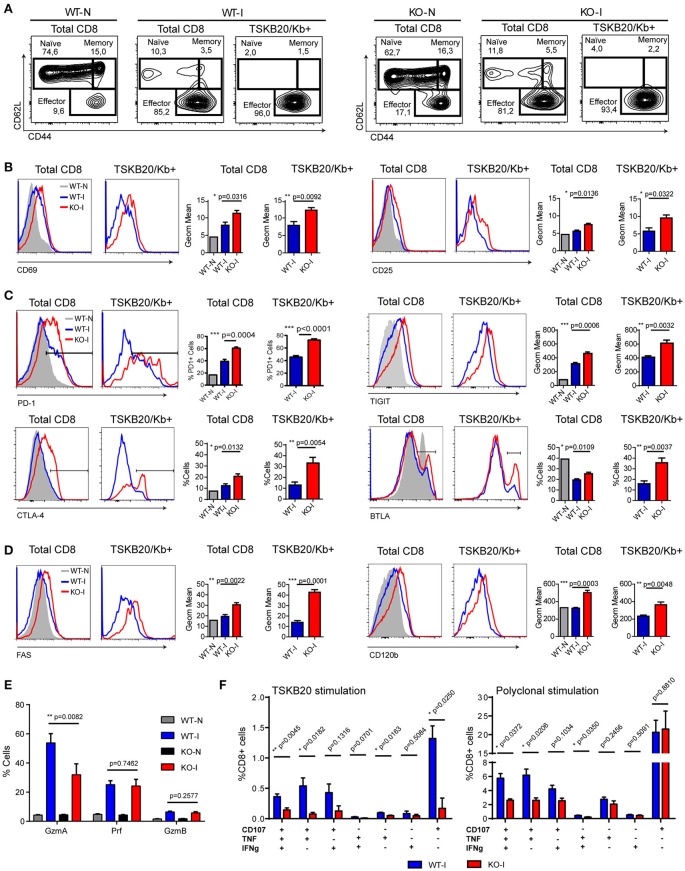
CD8+ T cells from T. cruzi infected IL-17RA KO mice show phenotypic and functional features compatible with exhausted cells. Representative flow cytometry data that show the phenotype of total and TSKB20/Kb+ CD8+ T cells from the spleen of infected WT (WT-I) and IL-17RA (KO-I) mice (22 dpi). Stainings of non-infected WT (WT-N) and KO (KO-N) mice are showed in plots or gray tinted histograms for comparison. (A) Plots of CD62L vs. CD44 expression. Gates indicate the frequency of naïve, memory and effector subsets. (B–D) Representative histograms and statistical analysis of the geometric mean of expression or percentage of cells that express activation markers (B), inhibitory receptors (C), and death receptors (D) in total and TSKB20/Kb+ CD8+ T cells from the spleen of infected WT (WT-I) and IL-17RA (KO-I) mice (22 dpi). Data in statistical analysis (B–D) are presented as mean ± SD, N = 4−6 mice. (E) Percentage of CD8+ T cells from the spleen of non-infected (N) and 22-day infected (I) WT and KO mice expressing Granzyme A (GzmA), Perforin (Prf) or Granzime B (GzmB) after 5 h of PMA/Ionomycin stimulation. Data shown as mean ± SD, N = 2−5 mice. (F) Percentage of CD8+ T cells from the spleen of 22-day infected WT and KO mice that exhibit different combinations of effector functions including CD107a mobilization and/or IFNγ and/or TNF production upon 5 h of the indicated stimulation. Data shown as mean ± SD, N = 5 mice. Data were background subtracted. All P values were calculated using two-tailed T test. Data are representative of two-three independent experiments.

