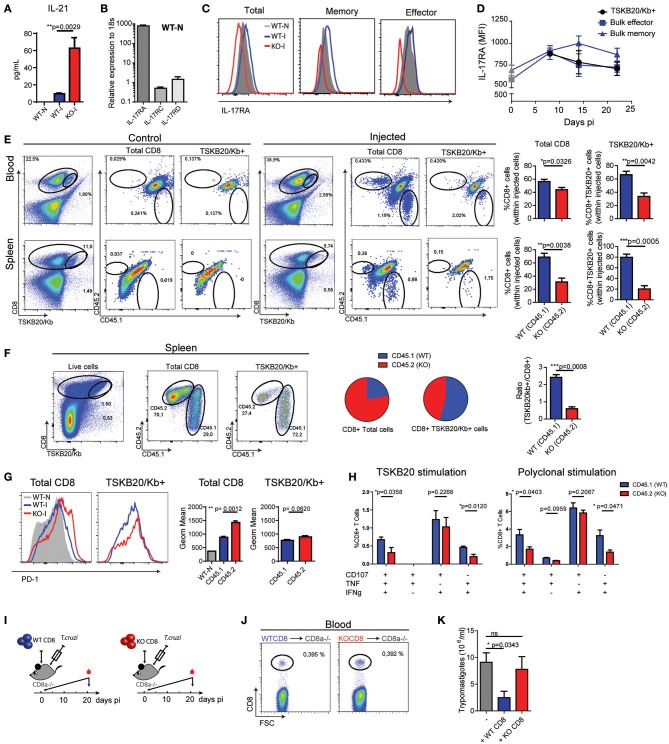
Figure 6.
Intrinsic IL-17RA-signaling modulates the maintenance, phenotype and function of CD8+ T cells during T. cruzi infection. (A) Concentration of IL-21 in plasma of infected (20 dpi) WT and IL-17RA KO mice. Data are presented as mean ± SD, N = 4 mice. (B) Amounts of Il17ra, Il17rc, and Il17rd transcript determined in CD8+ T cells purified from the spleen of non-infected WT mice, normalized to 18S RNA. Data are presented as mean ± SD, N = 4 mice (C) Representative histograms of the expression of IL-17RA (protein) on total, memory and effector CD8+ T cell subsets defined according to CD44 and CD62L staining in spleen cell suspensions from non-infected (N) and infected (I) WT mice (14 dpi). Staining of IL-17RA on spleen CD8+ T cells from IL-17RA KO mice is showed as negative control. (D) Kinetic evaluation of the upregulation of IL-17RA (MFI: mean of fluorescence intensity) induced by T. cruzi expression on bulk effector and memory CD8+ T cells and TSKB20-specific CD8+ T cells. Data in statistical analysis are presented as mean ± SD, N = 4. (E) Representative plots and statistical analysis of CD8 and TSKB20/Kb staining and of CD45.1 and CD45.2 staining within Total and TSKB20/Kb+ CD8+ T cells in the blood and spleen of infected CD45.1/CD45.2 WT recipient mice (20 dpi) non-injected (control) or injected with equal numbers of CD45.1+ WT and CD45.2+ KO CD8+ T cells. Numbers in the plots indicate the frequency of the correspondent cell subset. Bar graphs display the frequency of CD45.1+ WT cells and CD45.2+ KO cells within the indicated populations upon gating only in the injected cells. (F) Representative plots and statistical analysis of CD8 and TSKB20/Kb staining and of CD45.1 and CD45.2 staining within Total and TSKB20/Kb+ CD8+ T cells in the spleen of infected CD8α-/- recipients (17 dpi) injected with equal numbers of CD45.1+ WT and CD45.2+ KO CD8+ T cells. Pie charts display the frequency of CD45.1+ WT and CD45.2+ KO cells within the indicated gates. Bar graph shows the ratio between the frequencies of TSKB20/Kb+ CD8+ T cells and the total CD8+ T cells within CD45.1 WT and CD45.2 IL-17RA KO populations. (G) Representative histograms and statistical analysis of the geometric mean of PD-1 expression in total and TSKB20/Kb+ CD8+ T cells within CD45.1+ WT and CD45.2+ IL-17RA KO CD8+ T cells from the spleen of CD8α-/- recipient mice. Data in statistical analysis are presented as mean ± SD, N = 4−6 mice. (H) Percentage of polyfunctional effector cells denoted by expression CD107a, IFNγ and/or TNF upon 5 h of the indicated stimulation on CD45.1+ WT and CD45.2+ IL-17RA KO CD8+ T cells from the spleen of CD8α-/- recipient mice. Data shown as mean ± SD, N = 4 mice. Data were background subtracted. All P values in (E–G) were calculated using two-tailed T test. Data are representative of two independent experiments. (I) Experimental layout of the adoptive transfer of equal number of CD8+ T cells purified from WT mice or IL-17RA KO mice into CD8α knockout mice immediately followed by T. cruzi infection. N = 3 mice/group. (J) Representative dot plots of the frequency of CD8+ T cells determined 1 day after injection in blood of the different experimental groups. (K) Parasitemia (15 dpi) in the different experimental groups. Infected non-transferred CD8α knockout mice were used as control. P value calculated using Gehan-Breslow-Wilcoxon Test. Data in (A–J) are representative of two independent experiments.

