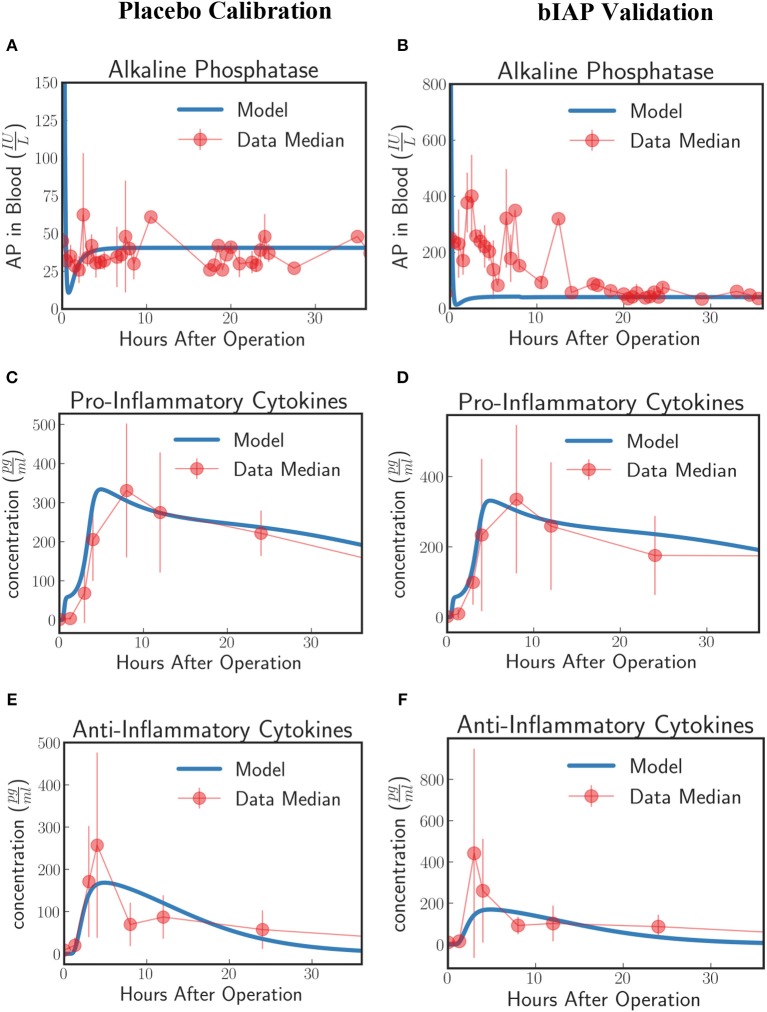
Figure 5.
Innate immune response to systemic inflammation without the induction term. The three plots (A,C,E) on the placebo calibration column summarize the result of the calibration of the model parameters using data from the placebo branch of APPIRED II. Data points are shown in red and correspond to the median value of the patients in this branch. The error bar shows the median absolute error. Blue lines correspond to the dynamics of the in silico model after calibration. (A) shows the dynamics of AP in blood. (B) shows the dynamics of the pro-inflammatory cytokine represented in the model compared against IL6 data. (C) shows the dynamics of anti-inflammatory cytokines in the model against IL10 data. The three plots (B,D,F) on the bIAP validation column show the validation of the model against data from the bIAP branch of APPIRED II. Without the induction term, we are not able to reproduce the Alkaline Phosphatase profile in the AP-treated patients. See unit conversion of AP and cytokines from in Equations (32) and (33) (section 10 of the Supplementary Material) respectively.

