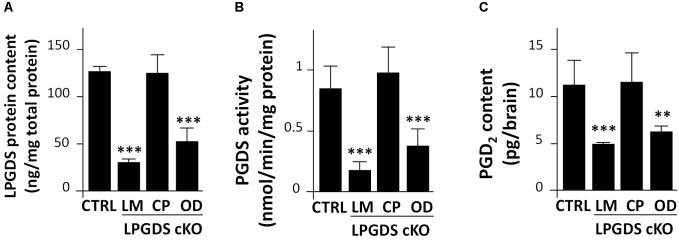
FIGURE 2.
Functional analysis of LPGDS disruption in the three conditional LPGDS KO mice. (A) Relative LPGDS protein content in the brain of LPGDSflox (CTRL), LM-LPGDS KO, CP-LPGDS KO, and OD-LPGDS KO mice. (B) PGDS activity in the brain of CTRL and cell type-specific KO mice. (C) PGD2 content in the brain of CTRL and cell type-specific KO mice. Values are means ± SEM (n = 6). ∗∗P < 0.01; ∗∗∗P < 0.001 compared with LPGDSflox (CTRL), one-way ANOVA followed by the Fisher protected least significant difference test.

