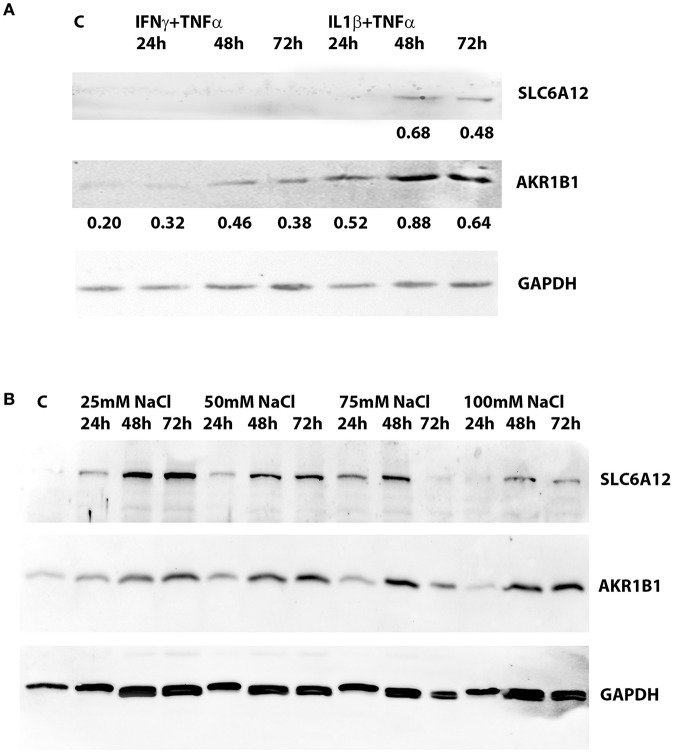
Figure 2.
Western blotting of protein extracts preepared from cultured normal human myotubes. (A) SLC6A12 and AKR1B1 protein levels in myotubes treated with cytokine mixtures. SLC6A12 and AKR1B1 proteins are visualized in control cells (C) and in cells treated for 24 h-48 h-72 h with either 300 u/ml IFNγ+30 ng/ml TNFα, or 20 ng/ml IL1β+30 ng/ml TNFα. SLC6A12 is undetectable in untreated- and in 300 u/ml IFNγ+30 ng/ml TNFα-treated cells, but is induced by treatment with 20 ng/ml IL1β+30 ng/ml TNFα from the 48 h time point on. Low constitutive levels of AKR1B1 in control cells are increased in myotubes treated with both cytokine mixtures, peaking at the 48 h time point. Relative protein densities of AKR1B1, normalized using glyceraldehyde 3-phosphate dehydrogenase (GAPDH) levels as an internal standard, have been indicated. (B) SLC6A12 and AKR1B1 protein levels in myotubes treated with added NaCl. Protein bands for SLC6A12 and AKR1B1, and the internal standard glyceraldehyde 3-phosphate dehydrogenase (GAPDH), are given in an untreated control (C) and in cells treated with different concentrations of added NaCl. A time-dependent increase is observed in cells treated with 25 and 50 mM added NaCl, while more elevated NaCl concentrations show the highest levels at the 48 h timepoint. The corresponding relative protein densities are listed in Table 4.

