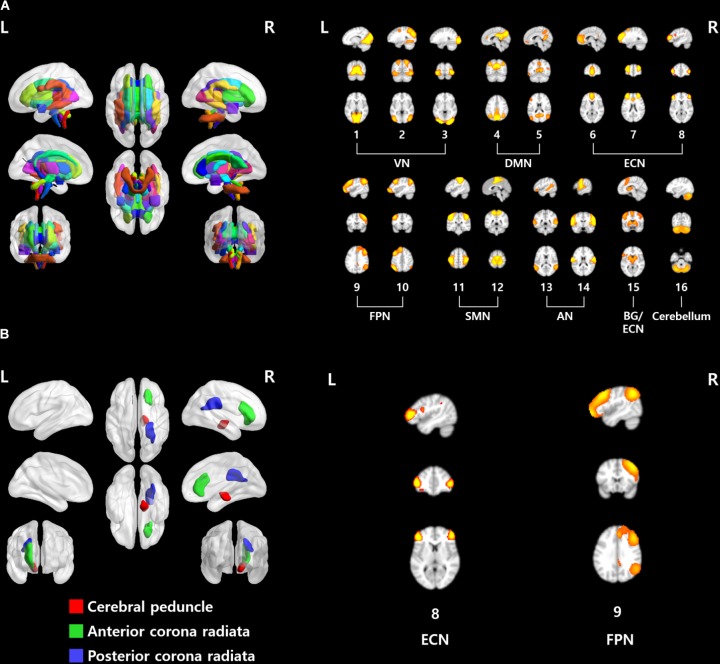
FIGURE 2.
(A) ROIs used in this study. (Left) ICBM DTI-81 atlas and (right) 16 functionally interpretable ICs. (B) Brain regions and networks that showed significant associations with EDE-Q scores. VN, visual network; DMN, default mode network; ECN, executive control network; FPN, frontoparietal network; SMN, sensorimotor network; AN, auditory network; BG, basal ganglia.

