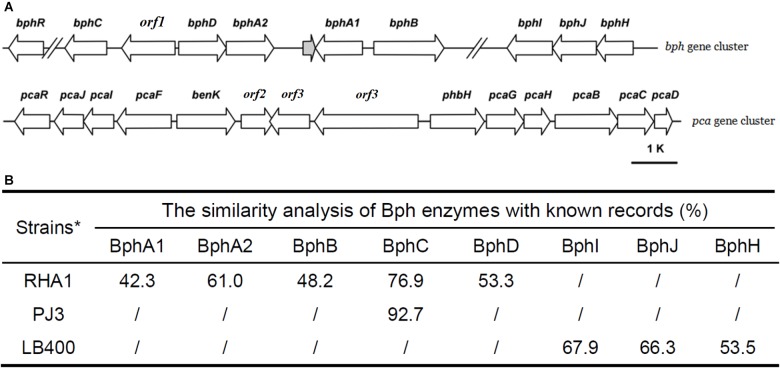
FIGURE 5.
The genetic organization of bph and pca gene cluster (A) and the similarity analysis of Bph enzymes with known records (B). [‘//’ means a long distance between two genes; the distance between bphC and bphR is 7192 bp; the distance between bphB and bphI is 62,400 bp; RHA1: Rhodococcus sp. RHA1 (Masai et al., 1997), LB400: Pseudomonas sp. LB400 (Hofer et al., 1994)].

