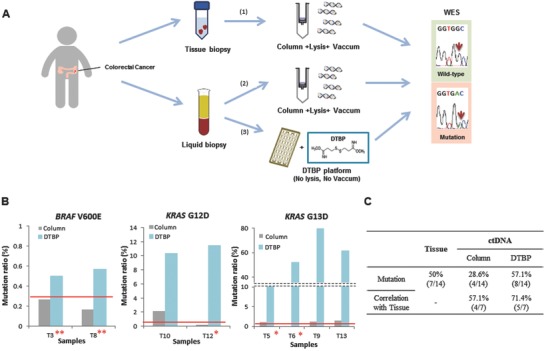
Figure 4.

Application of the DTBP platform for cfDNA isolation and ctDNA analysis. A) Workflow scheme of 14 clinical samples, including primary tissues and blood plasma from colorectal cancer patients. 1) Mutation screening using the column‐based method for extraction from tissue biopsies and whole exome sequencing (WES) for detection. 2) Mutation screening using the column‐based method for extraction from blood plasma and WES for detection. 3) Mutation screening using the DTBP platform for extraction from blood plasma and WES for detection. B) Mutation ratio of the isolated ctDNA using the column‐based method (gray) and the DTBP platform (sky blue) for detecting BRAF V600E (left), KRAS G12D (middle), and KRAS G13D (right) mutations. The red line represents the cut‐off (criterion) for reporting a sample once the mutation (positive/negative) was detected. Two asterisks (*) represent samples from which the mutation was detected in only cfDNA and not in tissue DNA. Dual asterisks (**) represent samples from which mutations were detected only in cfDNA using the DTBP platform but not using the column‐based method. C) Correlation between WES results of primary tissues and plasma among 14 clinical samples with the ctDNA isolated using the column‐based method and the DTBP platform.
