
Figure 6.
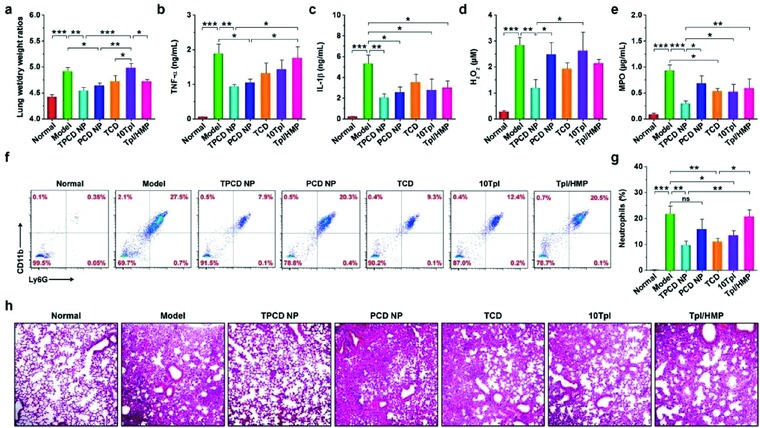
Comparison of in vivo efficacies of TPCD NP with different nanotherapy and small‐molecule controls in ALI mice. a) The lung wet‐to‐dry weight ratios after treatment with different formulations. b–e) The levels of TNF‐α, IL‐1β, H2O2, and MPO in bronchoalveolar lavage fluid from mice with LPS‐induced ALI and subjected to different treatments. f,g) Flow cytometric profiles and quantitative data of neutrophil counts in pulmonary tissues of ALI mice. h) H&E‐stained sections of lung tissues. ALI in mice was induced by intratracheal (i.t.) administration of LPS. After 1 h, mice were treated with different formulations via i.v. injection. The normal group was treated with saline. The PCD NP and TCD groups were administered at the same dose of the PBAP or Tpl unit as that of 1.0 mg kg−1 of TPCD NP, respectively. In the 10Tpl group, the Tpl dose was tenfold of that contained in TPCD NP. For the Tpl/HMP group, the Tpl dose was the same as that in TPCD NP, while the HMP dose equaled to that generated after complete hydrolysis of TPCD NP. At 12 h after different treatments, bronchoalveolar lavage fluid was collected for quantitative analyses. In a separate study, lung tissues were isolated for quantitative and histological analyses. Data are mean ± SE (a–e, g, n = 6). Statistical significance was assessed by one‐way ANOVA with post hoc LSD tests. *P < 0.05, **P < 0.01, ***P < 0.001; ns, no significance.