
Figure 8.
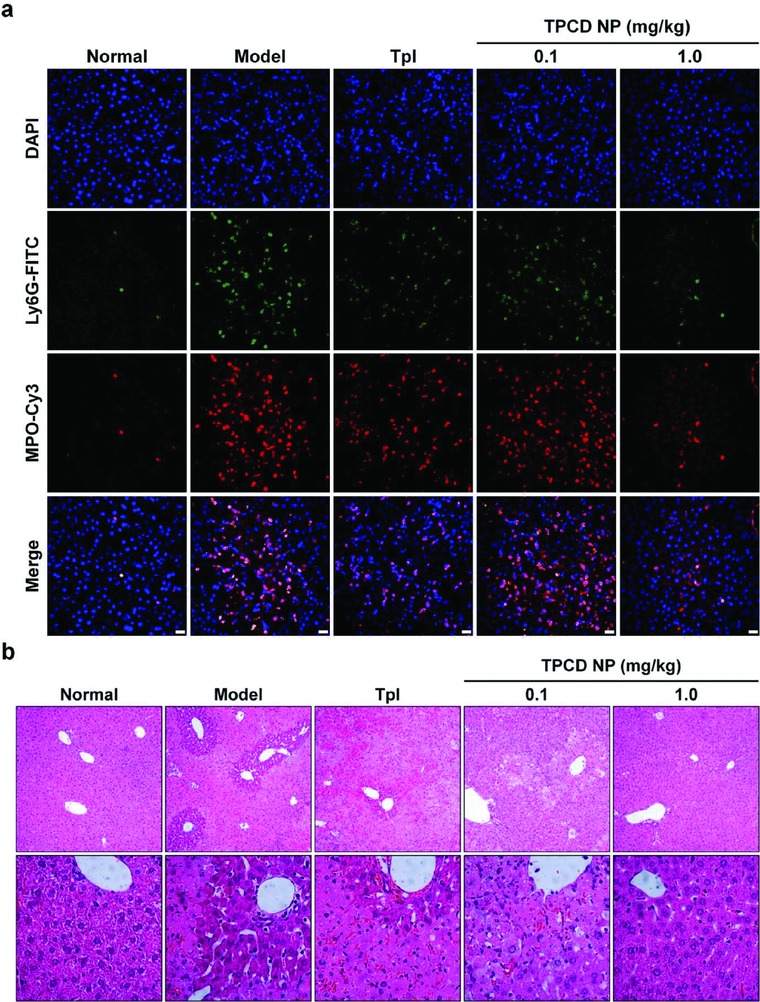
Evaluation of in vivo detoxification efficacy of TPCD NP in mice with APAP‐induced hepatotoxicity. a) Immunofluorescence images show the infiltration of neutrophils and expression of MPO in the liver. Scale bars, 20 µm. b) H&E‐stained histopathological sections of liver tissues resected from mice subjected to different treatments. The lower panel indicates high‐resolution images.