
Figure 9.
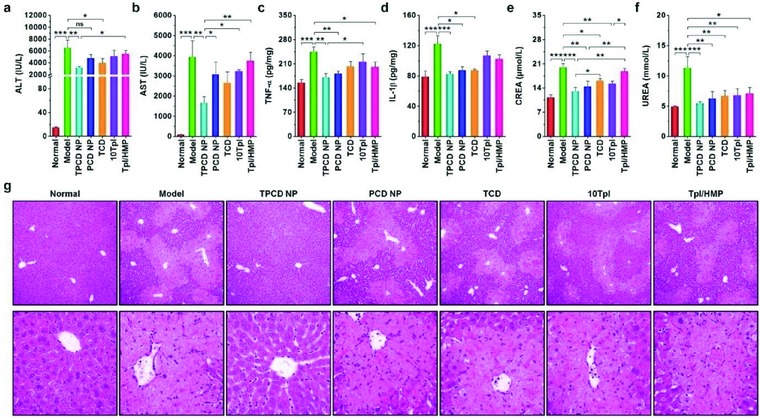
Comparison of in vivo detoxification efficacy of TPCD NP with different nanotherapy and small‐molecule controls in mice with APAP‐induced hepatotoxicity and renal injury. a,b) The levels of ALT and AST in serum collected from mice induced with APAP. c,d) The levels of TNF‐α and IL‐1β in the hepatic tissues. e,f) The serum levels of CREA and UREA. At 6 h after i.p. stimulation with APAP at 200 mg kg−1, mice were treated with different formulations. The PCD NP and TCD groups were treated at the same dose of the PBAP or Tpl unit as that of 1.0 mg kg−1 TPCD NP, respectively. In the 10Tpl group, the Tpl dose was tenfold of that contained in TPCD NP. For the Tpl/HMP group, the Tpl dose was the same as that in TPCD NP, while the HMP dose equaled to that generated after complete hydrolysis of TPCD NP. At 12 h after different treatments, animals were euthanized and serum was collected for quantification of biochemical markers. The liver tissues were isolated for quantification of inflammatory mediators. g) H&E‐stained histopathological sections of liver tissues. The lower panel indicates high‐resolution images. Data are mean ± SE (n = 6). Statistical significance was assessed by one‐way ANOVA with post hoc LSD tests for data in (a–c, e, f). *P < 0.05, **P < 0.01, ***P < 0.001; ns, no significance. Due to heterogeneity of variance, the Kruskal–Wallis test was used for statistical analysis of data in (d). *P < 0.01, ***P < 0.0001.