
Figure 3.
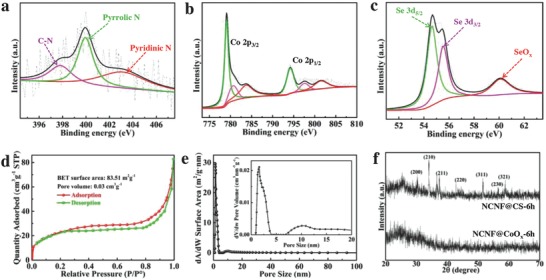
a) XPS spectra of N 1s in NCNF. XPS spectra of b) Co 2p and c) Se 3d in NCNF@CS‐6h. d) Nitrogen adsorption–desorption isotherm and e) pore size distribution of NCNF@CS‐6h. The inset of (e) is the partial enlarged detail. f) XRD patterns of the NCNF@CS‐6h and NCNF@CoOx‐6h.