
Figure 3.
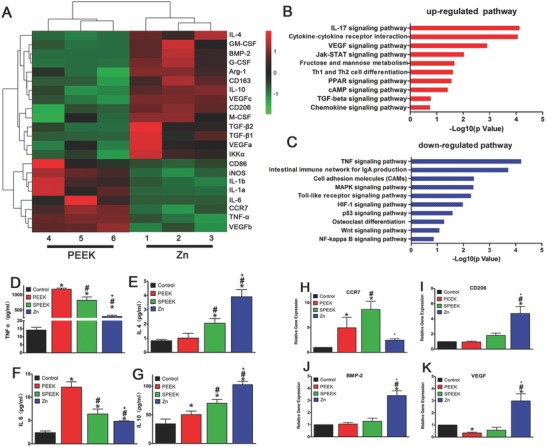
Gene expression analysis of RAW264.7 cultured on samples. A) Microarray heat map depicting the fold change of selected genes expression. B–C) Representative Top 10 upregulated or downregulated pathways analyzed by KEGG pathway method. D–G) Elisa results of TNF‐ɑ, IL‐4, IL‐6, and IL‐10 respectively. H–K) RT‐PCR results of CCR7, CD206, BMP‐2, and VEGF respectively. (*, #, and + represent p < 0.05 when compared with Control, PEEK, SPEEK, respectively).