
Figure 8.
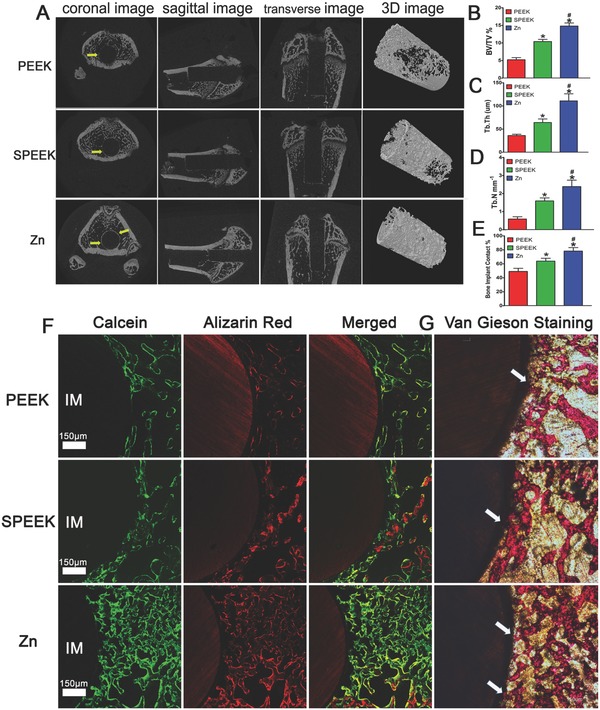
Results of the in vivo bone‐repairing model. A) Coronal, sagittal, transverse, and 3D images of Micro‐CT, yellow arrow indicates new bone. B–D) Quantitative analysis of Micro‐CT data: BV/TV%, Tb.Th, and Tb.N respectively. E) Bone implant contact measured from inset (G). F) Undecalcified sections of sequential polychrome labels for bone: red (Alizarin red), green (Calcein). G) Van Gieson staining of undecalcified sections, white arrow indicates bone implant contact. (* and # represent p < 0.05 when compared with PEEK, SPEEK respectively).