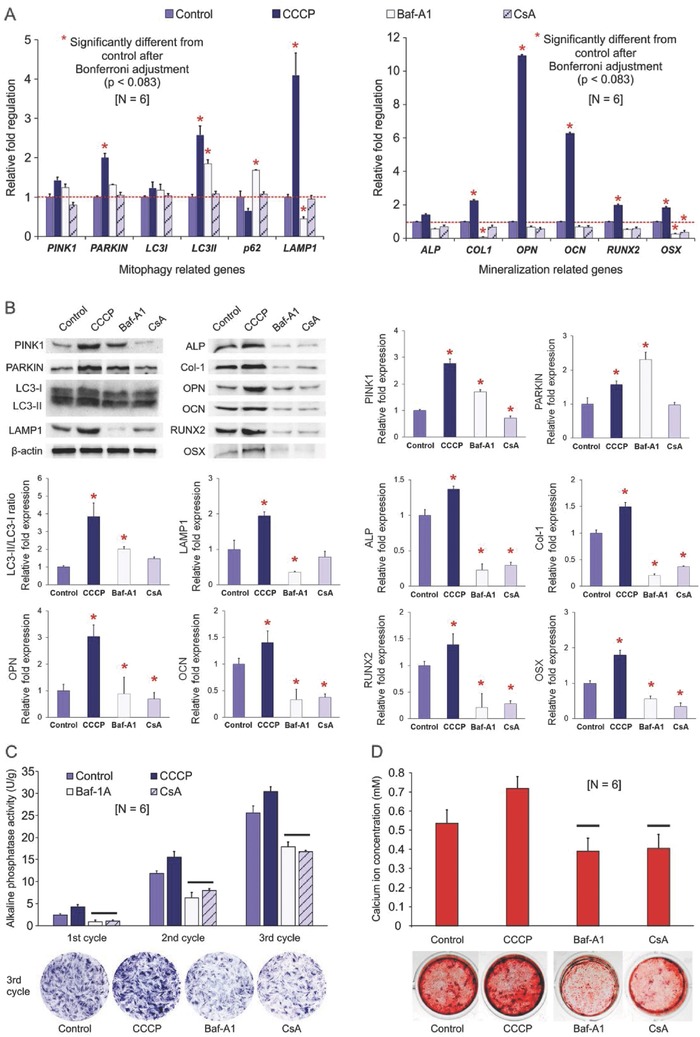
Figure 3.

Osteogenesis evaluation of differentiated hDPSCs treated with mitophagy stimulator and inhibitors. A) qRT‐PCR of differentiated hDPSCs (control) and hDPSCs treated with CCCP, Baf‐A1, or CsA for “one chemical reagent administration cycle” (see text). Left: Changes in fold regulations of mitophagy‐related genes. For each gene, group columns identified with asterisks were significantly different from the control (p < 0.0071 after Bonferroni adjustment). Right: Changes in fold regulations of mineralization‐related genes. For each gene, group columns identified with asterisks were significantly different from the control (p < 0.00083 after Bonferroni adjustment). B) Western blot results of selected mitophagy‐related and mineralization‐related proteins obtained from differentiated hDPSCs (control) and hDPSCs treated with CCCP, Baf‐A1, or CsA for three “chemical reagent administration cycles”. For each protein, group columns identified with asterisks were significantly different from the control (p < 0.05). C) ALP enzyme activity of the four groups after one to three “chemical reagent administration cycles.” For each cycle, group columns connected with a bar were not significantly different (p > 0.05). Representative ALP staining of the hDPSCs after three cycles is shown at the bottom of the chart. D) Analysis of extracellular calcium content in the four groups after four “chemical reagent administration cycles,” Group columns labeled with bars were not significantly different (p > 0.05). Representative alizarin red S‐stained hDPSCs are shown at the bottom of the chart.
