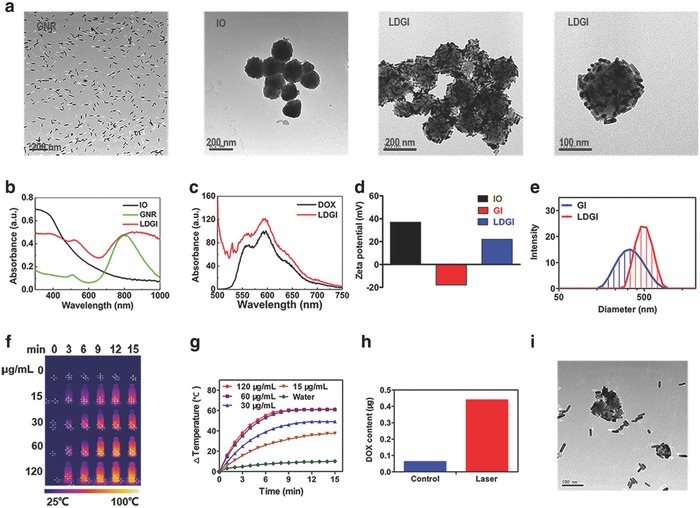
Figure 1.

Characterization of LDGI. a) Representative TEM images of GNR, IO, and LDGI. b) UV–vis spectra of IO, GNR, and LDGI. c) Fluorescence spectra of LDGI and DOX (1 µg mL−1). d) Zeta potential of IO, GNR, and LDGI in deionized water. e) Size distribution of GI and LDGI in deionized water. f) Photothermal effect of LDGI at different concentrations and g) the corresponding temperature changing curves under 808 nm laser at 3 W cm−2 for 15 min. h) Drug release behavior of the LDGI aqueous solution with laser irradiation (3 W cm−2, 3 min). i) The TEM image of LDGI post irradiation.
