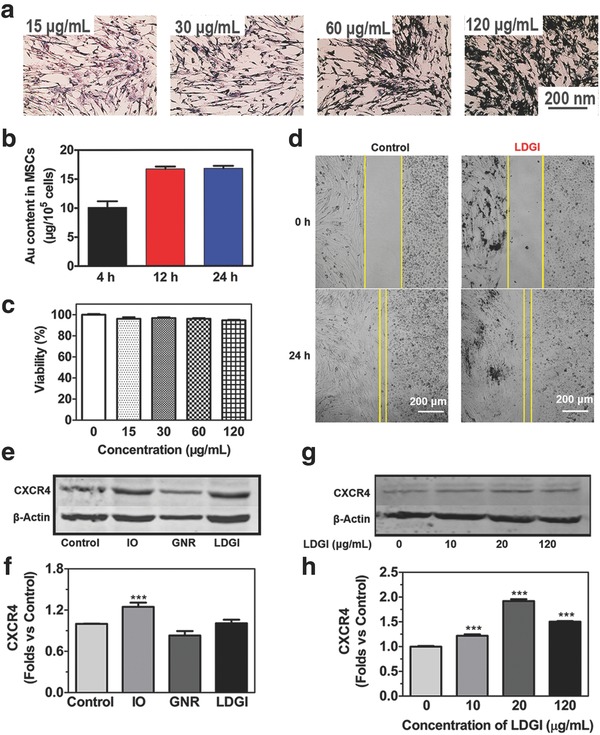
Figure 2.

Loading LDGI into MSCs and the migration ability of the combination platform. a) Prussian blue stain of MSCs treated with different concentrations of LDGI (15, 30, 60, 120 µg mL−1) after 24 h incubation. b) ICP‐MS quantification of LDGI at the incubation times of 4, 12, and 24 h. c) Cell viability with different concentrations of LDGI. d) MSCs migration toward MDA‐MB‐231 cells treated with 25 µg mL−1 LDGI and without LDGI in 24 h. e) Western blot analysis of CXCR4 expression in MSCs after treatment with nanoparticles including IO, GNR, and LDGI. f) Quantification of the western blotting results in (e). g) Specific surface markers of stem cells expression on MSCs treated with different concentrations of LDGI and h) the quantification of western blotting results by measuring the band density and then normalizing it to β‐actin.
