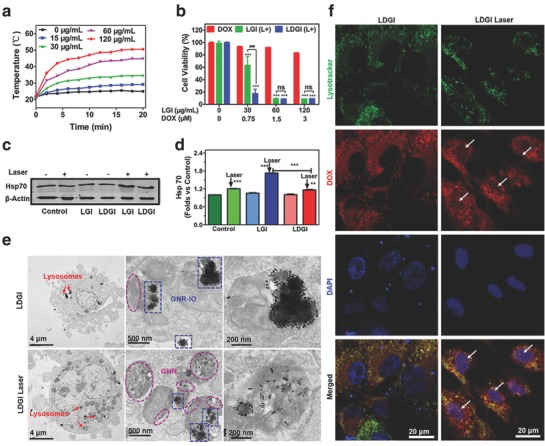
Figure 3.

NIR light–triggered DOX release and photothermal effect of LDGI. a) Temperature rising curve of MSCs incubated with LDGI at different concentrations (0, 30, 60, 120 µg mL−1) with laser irradiation (3 W cm−2, 20 min). b) Cell viability of MSCs incubated with DOX, LGI, and LDGI nanoparticles for 24 h and treated with NIR laser (3 W cm−2, 5 min). c) Western blot analysis of Hsp70 protein expression in MSCs after treatment with nanoparticles including LGI and LDGI post laser irradiation (1.5 W cm−2, 5 min) and d) the quantification of western blotting results by measuring the band density and then normalizing according to β‐actin. e) Representative TEM images of LDGI‐loaded MSCs treated with and without laser (3 W cm−2, 5 min). f) Confocal images of DOX release from LDGI in MSCs before and after laser (3 W cm−2, 5 min). Green fluorescence represents the lysotracker green accumulated in lysosomes, red fluorescence represents DOX trapped in LDGI and free DOX, and blue fluorescence represents 4′,6‐diamidino‐2‐phenylindole (DAPI) in the cell nucleus.
