Figure 4.

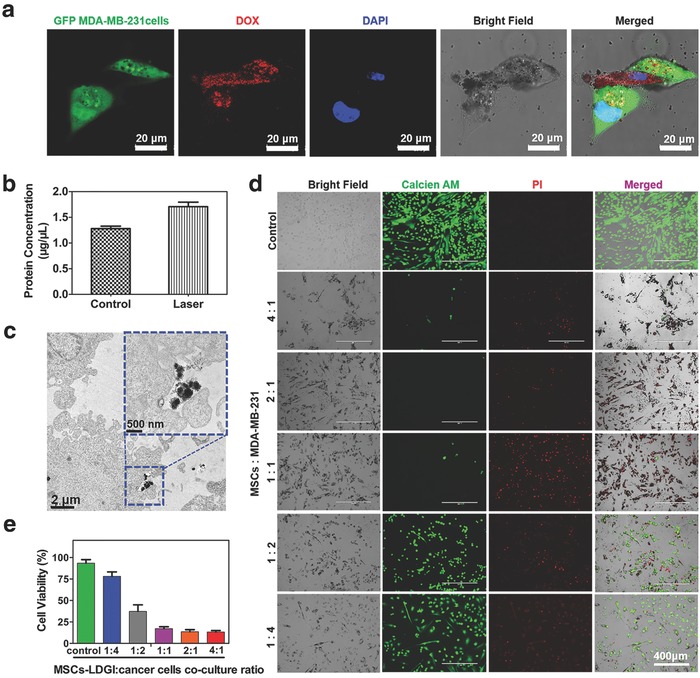
The anticancer effect of MSCs‐LDGI against MDA‐MB‐231 cells. a) Confocal images of green florescence protein (GFP)‐labeled MDA‐MB‐231 cells cocultured with MSCs‐LDGI (green florescence represents MDA‐MB‐231 cells, red florescence represents DOX trapped in LDGI, and blue florescence represents the cell nucleus). b) Protein quantification of cells culture medium after laser irradiation (1.5 W cm−2, 5 min). c) TEM image of exocytosis of LDGI from MSCs‐LDGI post 24 h incubation. d) LIVE/DEAD cell viability tests of MSCs‐LDGI cocultured with MDA‐MB‐231 cells post laser irradiation (green fluorescence represents live cells stained with calcein‐AM solution and red fluorescence represents dead cells stained with propidium iodide (PI) solution). e) Cell viability of MSCs‐LDGI and MDA‐MB‐231 cells with different ratios for 24 h with and without irradiation tested by CCK‐8 kit after 24 h.
