Figure 6.

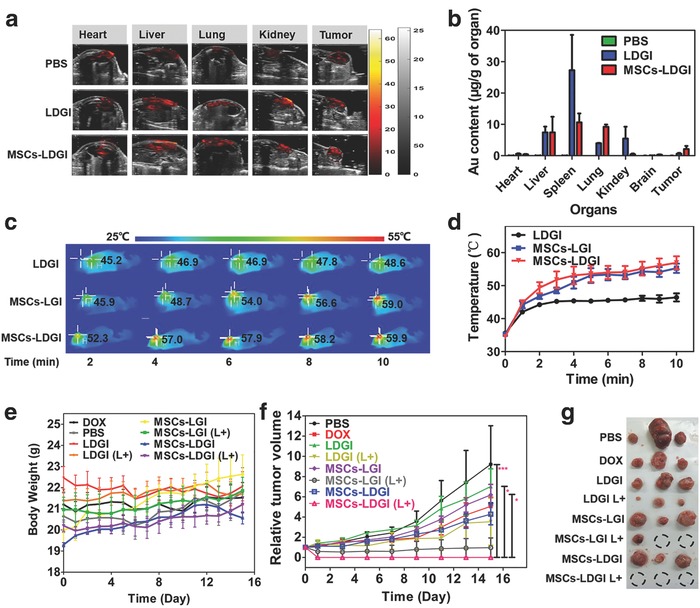
In vivo antitumor effect of MSCs‐LDGI via intravenous injection. a) In vivo photoacoustic image of mice organs of MSCs‐LDGI, LDGI, and PBS, respectively. b) Biodistribution of gold amount in heart, liver, spleen, lung, kidney, brain, and tumor tissues post 3 days of intravenous injection. c) In vivo infrared thermal images and d) the corresponding temperature increasing curves of LDGI, MSCs‐LGI, and MSCs‐LDGI with continuous laser irradiation of 808 nm laser (1.5 W cm−2, 10 min). e) Body weight curves of mice injected with DOX, PBS, LDGI, MSCs‐LGI, MSCs‐LDGI with and without NIR laser. f) Relative tumor volumes and g) the image of tumors from the mice treated with DOX, PBS, LDGI, MSCs‐LGI, MSCs‐LDGI with and without NIR laser irradiation post 15 days.
